29
/
en
AIzaSyAYiBZKx7MnpbEhh9jyipgxe19OcubqV5w
April 1, 2024
51218
Middle income
MIC
false
2
1
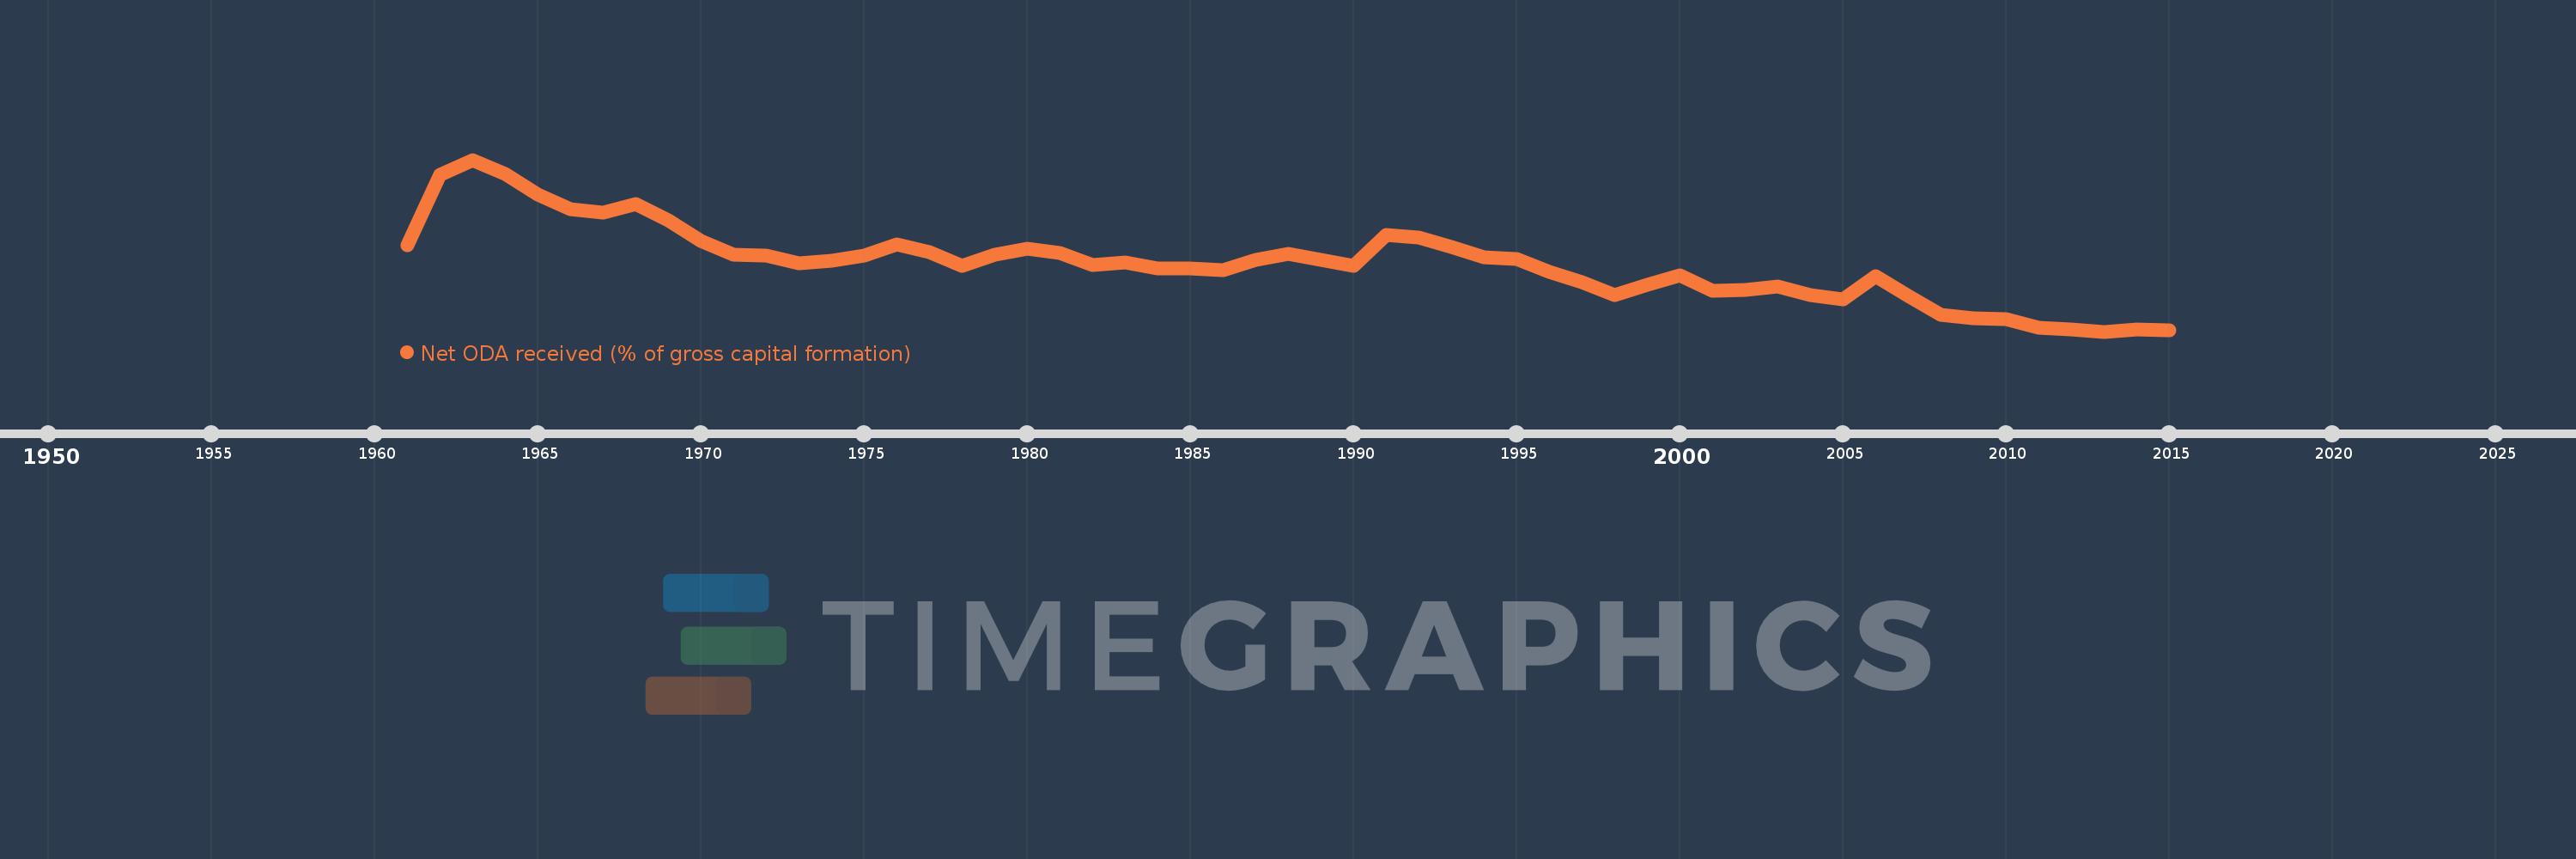
Net ODA received (% of gross capital formation)
2015,2014,2013,2012,2011,2010,2009,2008,2007,2006,2005,2004,2003,2002,2001,2000,1999,1998,1997,1996,1995,1994,1993,1992,1991,1990,1989,1988,1987,1986,1985,1984,1983,1982,1981,1980,1979,1978,1977,1976,1975,1974,1973,1972,1971,1970,1969,1968,1967,1966,1965,1964,1963,1962,1961
This statistics in other country:
AfghanistanAlbaniaAlgeriaAngolaAntigua and BarbudaArab WorldArgentinaArmeniaArubaAzerbaijanBahamas, TheBahrainBangladeshBarbadosBelarusBelizeBeninBhutanBoliviaBosnia and HerzegovinaBotswanaBrazilBrunei DarussalamBurkina FasoBurundiCabo VerdeCambodiaCameroonCaribbean small statesCentral African RepublicCentral Europe and the BalticsChadChileChinaColombiaComorosCongo, Dem. Rep.Congo, Rep.Costa RicaCote d'IvoireCroatiaCubaCyprusDjiboutiDominicaDominican RepublicEast Asia & PacificEast Asia & Pacific (excluding high income)East Asia & Pacific (IDA & IBRD countries)EcuadorEgypt, Arab Rep.El SalvadorEquatorial GuineaEritreaEthiopiaEuro areaEurope & Central AsiaEurope & Central Asia (excluding high income)Europe & Central Asia (IDA & IBRD countries)European UnionFijiFragile and conflict affected situationsGabonGambia, TheGeorgiaGhanaGrenadaGuatemalaGuineaGuinea-BissauGuyanaHaitiHeavily indebted poor countries (HIPC)High incomeHondurasHong Kong SAR, ChinaIBRD onlyIDA & IBRD totalIDA blendIDA onlyIDA totalIndiaIndonesiaIran, Islamic Rep.IraqIsraelJamaicaJordanKazakhstanKenyaKiribatiKorea, Rep.KosovoKuwaitKyrgyz RepublicLao PDRLatin America & Caribbean Latin America & Caribbean (excluding high income)Latin America & the Caribbean (IDA & IBRD countries)Least developed countries: UN classificationLebanonLesothoLiberiaLibyaLow & middle incomeLow incomeLower middle incomeMacao SAR, ChinaMacedonia, FYRMadagascarMalawiMalaysiaMaldivesMaliMaltaMauritaniaMauritiusMexicoMiddle East & North AfricaMiddle East & North Africa (excluding high income)Middle East & North Africa (IDA & IBRD countries)Middle incomeMoldovaMongoliaMontenegroMoroccoMozambiqueNamibiaNepalNew CaledoniaNicaraguaNigerNigeriaNorth AmericaOECD membersOmanOther small statesPakistanPanamaPapua New GuineaParaguayPeruPhilippinesQatarRwandaSaudi ArabiaSenegalSerbiaSeychellesSierra LeoneSingaporeSloveniaSmall statesSolomon IslandsSouth AfricaSouth AsiaSouth Asia (IDA & IBRD)South SudanSri LankaSt. Kitts and NevisSt. LuciaSt. Vincent and the GrenadinesSub-Saharan Africa Sub-Saharan Africa (excluding high income)Sub-Saharan Africa (IDA & IBRD countries)SudanSurinameSwazilandSyrian Arab RepublicTajikistanTanzaniaThailandTimor-LesteTogoTongaTrinidad and TobagoTunisiaTurkeyTurkmenistanUgandaUkraineUpper middle incomeUruguayUzbekistanVanuatuVenezuela, RBVietnamWest Bank and GazaWorldYemen, Rep.ZambiaZimbabwe Timeline:
This timeline shows a graph from 1961 to 2015 of Middle income. No data until 1960. Number of actual observations by date: 55.
Source name:
World Development Indicators
Source organization:
Development Assistance Committee of the Organisation for Economic Co-operation and Development, Geographical Distribution of Financial Flows to Developing Countries, Development Co-operation Report, and International Development Statistics database. Data are available online at: www.oecd.org/dac/stats/idsonline. World Bank gross capital formation estimates are used for the denominator.
Categories, topics:
Aid Effectiveness
Last updated:
apr 23, 2017
Indicators value changes by year
At the date of observation
Value
Absolute change
Change from previous value
jan 1, 1961
3.65
+3.65
0.0%
jan 1, 1962
6.039
+2.389
65.46%
jan 1, 1963
6.535
+0.495
8.2%
jan 1, 1964
6.055
-0.479
-7.34%
jan 1, 1965
5.369
-0.687
-11.34%
jan 1, 1966
4.852
-0.517
-9.62%
jan 1, 1967
4.731
-0.121
-2.49%
jan 1, 1968
5.035
+0.304
6.42%
jan 1, 1969
4.474
-0.561
-11.15%
jan 1, 1970
3.794
-0.68
-15.2%
jan 1, 1971
3.306
-0.488
-12.87%
jan 1, 1972
3.276
-0.029
-0.89%
jan 1, 1973
3.014
-0.262
-7.99%
jan 1, 1974
3.106
+0.092
3.04%
jan 1, 1975
3.298
+0.192
6.18%
jan 1, 1976
3.667
+0.369
11.19%
jan 1, 1977
3.391
-0.276
-7.52%
jan 1, 1978
2.943
-0.449
-13.23%
jan 1, 1979
3.33
+0.387
13.16%
jan 1, 1980
3.518
+0.188
5.64%
jan 1, 1981
3.384
-0.133
-3.79%
jan 1, 1982
2.978
-0.407
-12.02%
jan 1, 1983
3.058
+0.081
2.7%
jan 1, 1984
2.854
-0.205
-6.69%
jan 1, 1985
2.844
-0.01
-0.35%
jan 1, 1986
2.79
-0.054
-1.88%
jan 1, 1987
3.131
+0.341
12.23%
jan 1, 1988
3.338
+0.207
6.6%
jan 1, 1989
3.129
-0.209
-6.27%
jan 1, 1990
2.939
-0.189
-6.05%
jan 1, 1991
3.989
+1.05
35.71%
jan 1, 1992
3.891
-0.098
-2.46%
jan 1, 1993
3.577
-0.313
-8.05%
jan 1, 1994
3.227
-0.351
-9.81%
jan 1, 1995
3.162
-0.064
-1.99%
jan 1, 1996
2.738
-0.424
-13.41%
jan 1, 1997
2.378
-0.361
-13.17%
jan 1, 1998
1.96
-0.418
-17.58%
jan 1, 1999
2.306
+0.346
17.65%
jan 1, 2000
2.619
+0.314
13.6%
jan 1, 2001
2.097
-0.522
-19.93%
jan 1, 2002
2.112
+0.015
0.71%
jan 1, 2003
2.232
+0.12
5.67%
jan 1, 2004
1.957
-0.275
-12.32%
jan 1, 2005
1.811
-0.146
-7.44%
jan 1, 2006
2.584
+0.773
42.66%
jan 1, 2007
1.923
-0.66
-25.56%
jan 1, 2008
1.275
-0.648
-33.71%
jan 1, 2009
1.166
-0.109
-8.56%
jan 1, 2010
1.123
-0.043
-3.69%
jan 1, 2011
0.837
-0.286
-25.45%
jan 1, 2012
0.774
-0.063
-7.57%
jan 1, 2013
0.708
-0.066
-8.47%
jan 1, 2014
0.791
+0.083
11.76%
jan 1, 2015
0.746
-0.046
-5.79%
Ranking of countries by current statistics by years


Comments: