29
/
en
AIzaSyAYiBZKx7MnpbEhh9jyipgxe19OcubqV5w
April 1, 2024
252213
St. Vincent and the Grenadines
VCT
true
2
1
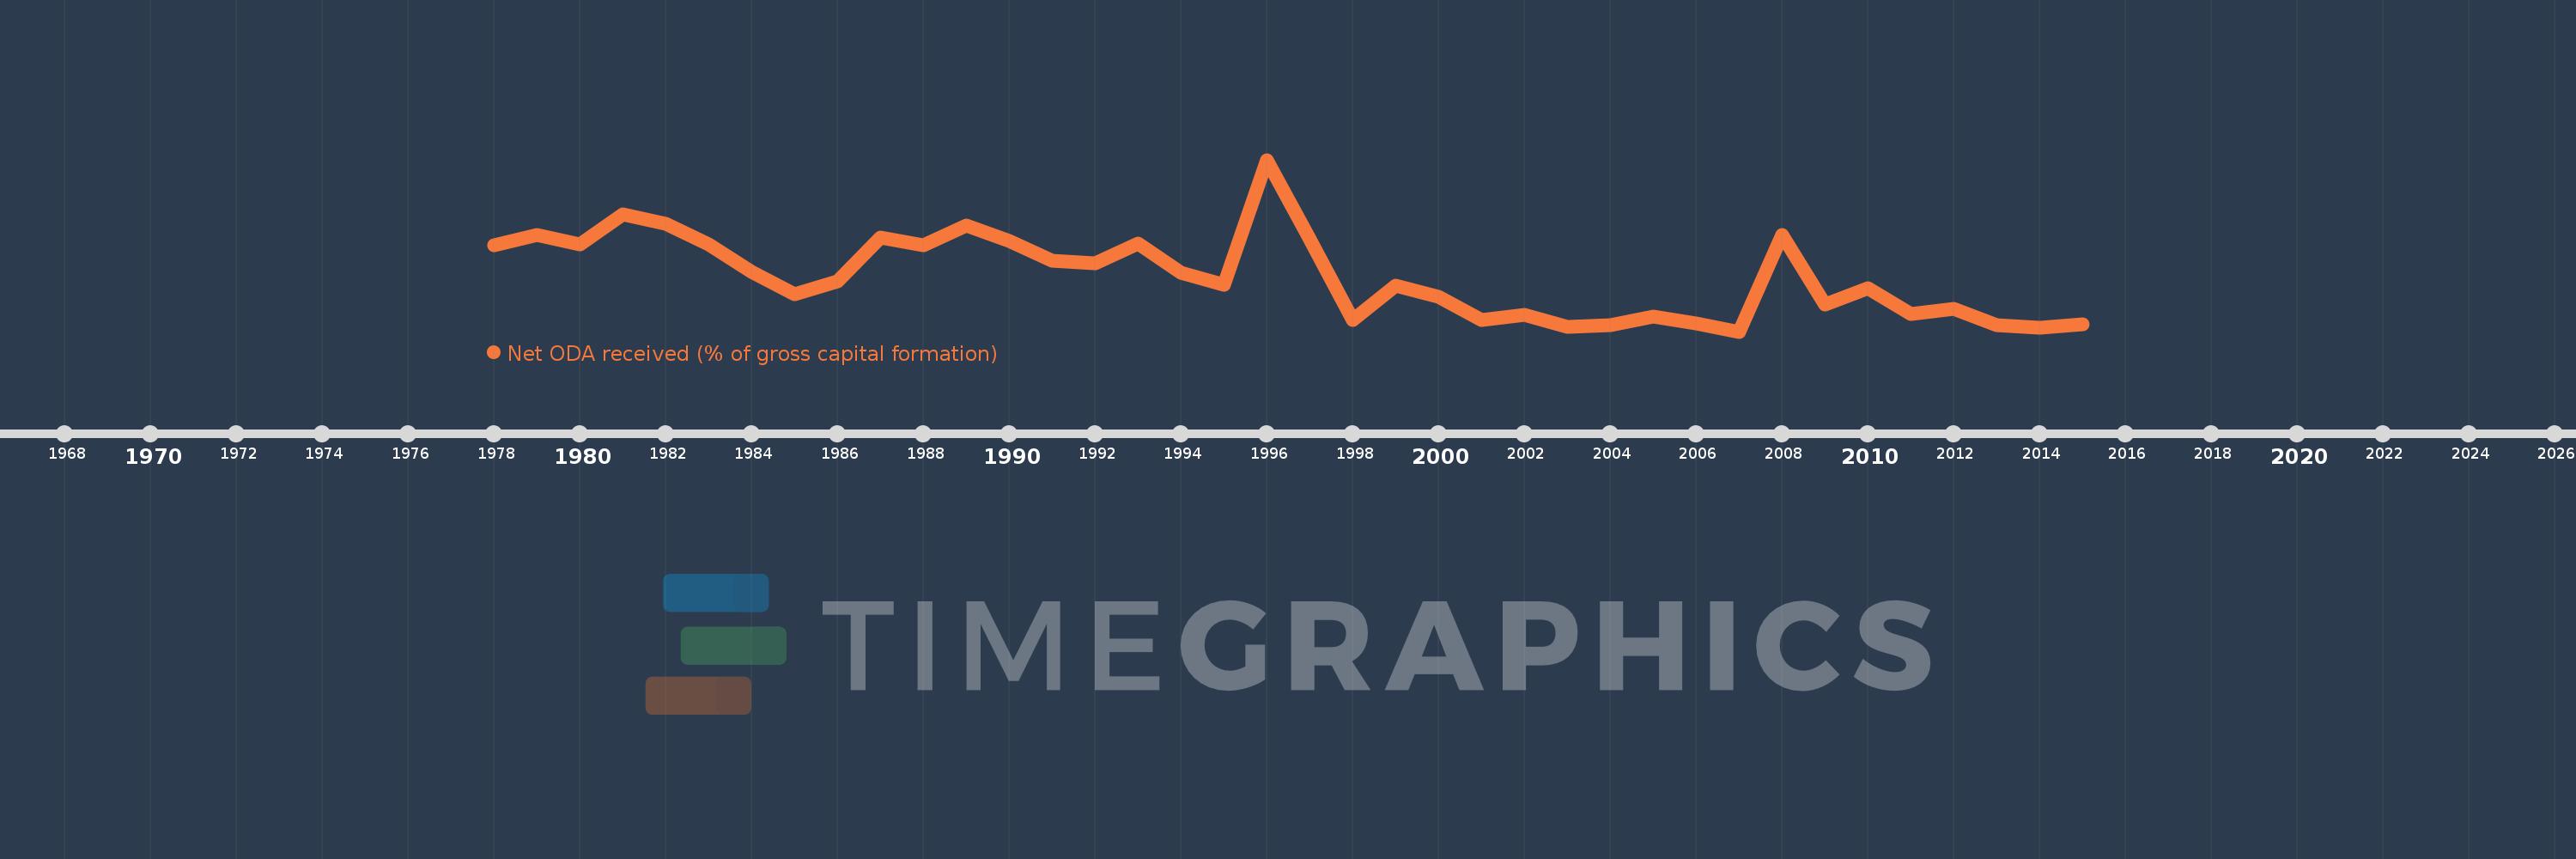
Net ODA received (% of gross capital formation)
2015,2014,2013,2012,2011,2010,2009,2008,2007,2006,2005,2004,2003,2002,2001,2000,1999,1998,1997,1996,1995,1994,1993,1992,1991,1990,1989,1988,1987,1986,1985,1984,1983,1982,1981,1980,1979,1978
This statistics in other country:
AfghanistanAlbaniaAlgeriaAngolaAntigua and BarbudaArab WorldArgentinaArmeniaArubaAzerbaijanBahamas, TheBahrainBangladeshBarbadosBelarusBelizeBeninBhutanBoliviaBosnia and HerzegovinaBotswanaBrazilBrunei DarussalamBurkina FasoBurundiCabo VerdeCambodiaCameroonCaribbean small statesCentral African RepublicCentral Europe and the BalticsChadChileChinaColombiaComorosCongo, Dem. Rep.Congo, Rep.Costa RicaCote d'IvoireCroatiaCubaCyprusDjiboutiDominicaDominican RepublicEast Asia & PacificEast Asia & Pacific (excluding high income)East Asia & Pacific (IDA & IBRD countries)EcuadorEgypt, Arab Rep.El SalvadorEquatorial GuineaEritreaEthiopiaEuro areaEurope & Central AsiaEurope & Central Asia (excluding high income)Europe & Central Asia (IDA & IBRD countries)European UnionFijiFragile and conflict affected situationsGabonGambia, TheGeorgiaGhanaGrenadaGuatemalaGuineaGuinea-BissauGuyanaHaitiHeavily indebted poor countries (HIPC)High incomeHondurasHong Kong SAR, ChinaIBRD onlyIDA & IBRD totalIDA blendIDA onlyIDA totalIndiaIndonesiaIran, Islamic Rep.IraqIsraelJamaicaJordanKazakhstanKenyaKiribatiKorea, Rep.KosovoKuwaitKyrgyz RepublicLao PDRLatin America & Caribbean Latin America & Caribbean (excluding high income)Latin America & the Caribbean (IDA & IBRD countries)Least developed countries: UN classificationLebanonLesothoLiberiaLibyaLow & middle incomeLow incomeLower middle incomeMacao SAR, ChinaMacedonia, FYRMadagascarMalawiMalaysiaMaldivesMaliMaltaMauritaniaMauritiusMexicoMiddle East & North AfricaMiddle East & North Africa (excluding high income)Middle East & North Africa (IDA & IBRD countries)Middle incomeMoldovaMongoliaMontenegroMoroccoMozambiqueNamibiaNepalNew CaledoniaNicaraguaNigerNigeriaNorth AmericaOECD membersOmanOther small statesPakistanPanamaPapua New GuineaParaguayPeruPhilippinesQatarRwandaSaudi ArabiaSenegalSerbiaSeychellesSierra LeoneSingaporeSloveniaSmall statesSolomon IslandsSouth AfricaSouth AsiaSouth Asia (IDA & IBRD)South SudanSri LankaSt. Kitts and NevisSt. LuciaSt. Vincent and the GrenadinesSub-Saharan Africa Sub-Saharan Africa (excluding high income)Sub-Saharan Africa (IDA & IBRD countries)SudanSurinameSwazilandSyrian Arab RepublicTajikistanTanzaniaThailandTimor-LesteTogoTongaTrinidad and TobagoTunisiaTurkeyTurkmenistanUgandaUkraineUpper middle incomeUruguayUzbekistanVanuatuVenezuela, RBVietnamWest Bank and GazaWorldYemen, Rep.ZambiaZimbabwe Timeline:
This timeline shows a graph from 1978 to 2015 of St. Vincent and the Grenadines. No data until 1977. Number of actual observations by date: 38.
Source name:
World Development Indicators
Source organization:
Development Assistance Committee of the Organisation for Economic Co-operation and Development, Geographical Distribution of Financial Flows to Developing Countries, Development Co-operation Report, and International Development Statistics database. Data are available online at: www.oecd.org/dac/stats/idsonline. World Bank gross capital formation estimates are used for the denominator.
Categories, topics:
Aid Effectiveness
Last updated:
apr 23, 2017
Indicators value changes by year
Maximum:
59.705
jan 1, 1996
At the date of observation
Value
Absolute change
Change from previous value
jan 1, 1978
31.479
+31.479
0.0%
jan 1, 1979
34.879
+3.401
10.8%
jan 1, 1980
31.654
-3.226
-9.25%
jan 1, 1981
41.677
+10.024
31.67%
jan 1, 1982
38.469
-3.208
-7.7%
jan 1, 1983
31.627
-6.842
-17.79%
jan 1, 1984
22.579
-9.049
-28.61%
jan 1, 1985
15.16
-7.419
-32.86%
jan 1, 1986
19.45
+4.291
28.3%
jan 1, 1987
33.88
+14.429
74.19%
jan 1, 1988
31.32
-2.56
-7.56%
jan 1, 1989
37.791
+6.471
20.66%
jan 1, 1990
32.916
-4.875
-12.9%
jan 1, 1991
26.089
-6.828
-20.74%
jan 1, 1992
25.462
-0.626
-2.4%
jan 1, 1993
32.042
+6.58
25.84%
jan 1, 1994
22.36
-9.682
-30.22%
jan 1, 1995
18.379
-3.981
-17.81%
jan 1, 1996
59.705
+41.326
224.86%
jan 1, 1997
33.395
-26.31
-44.07%
jan 1, 1998
6.533
-26.861
-80.44%
jan 1, 1999
18.076
+11.543
176.68%
jan 1, 2000
14.298
-3.779
-20.9%
jan 1, 2001
6.662
-7.635
-53.4%
jan 1, 2002
8.154
+1.492
22.4%
jan 1, 2003
4.256
-3.898
-47.8%
jan 1, 2004
4.873
+0.617
14.49%
jan 1, 2005
7.655
+2.782
57.09%
jan 1, 2006
5.569
-2.086
-27.25%
jan 1, 2007
2.72
-2.849
-51.16%
jan 1, 2008
34.868
+32.148
1.18K%
jan 1, 2009
11.652
-23.216
-66.58%
jan 1, 2010
17.198
+5.546
47.6%
jan 1, 2011
8.533
-8.665
-50.38%
jan 1, 2012
10.391
+1.859
21.78%
jan 1, 2013
4.858
-5.533
-53.25%
jan 1, 2014
4.026
-0.832
-17.13%
jan 1, 2015
5.068
+1.042
25.89%
Ranking of countries by current statistics by years


Comments: