29
/
en
AIzaSyAYiBZKx7MnpbEhh9jyipgxe19OcubqV5w
April 1, 2024
73966
Austria
AUT
true
2
1
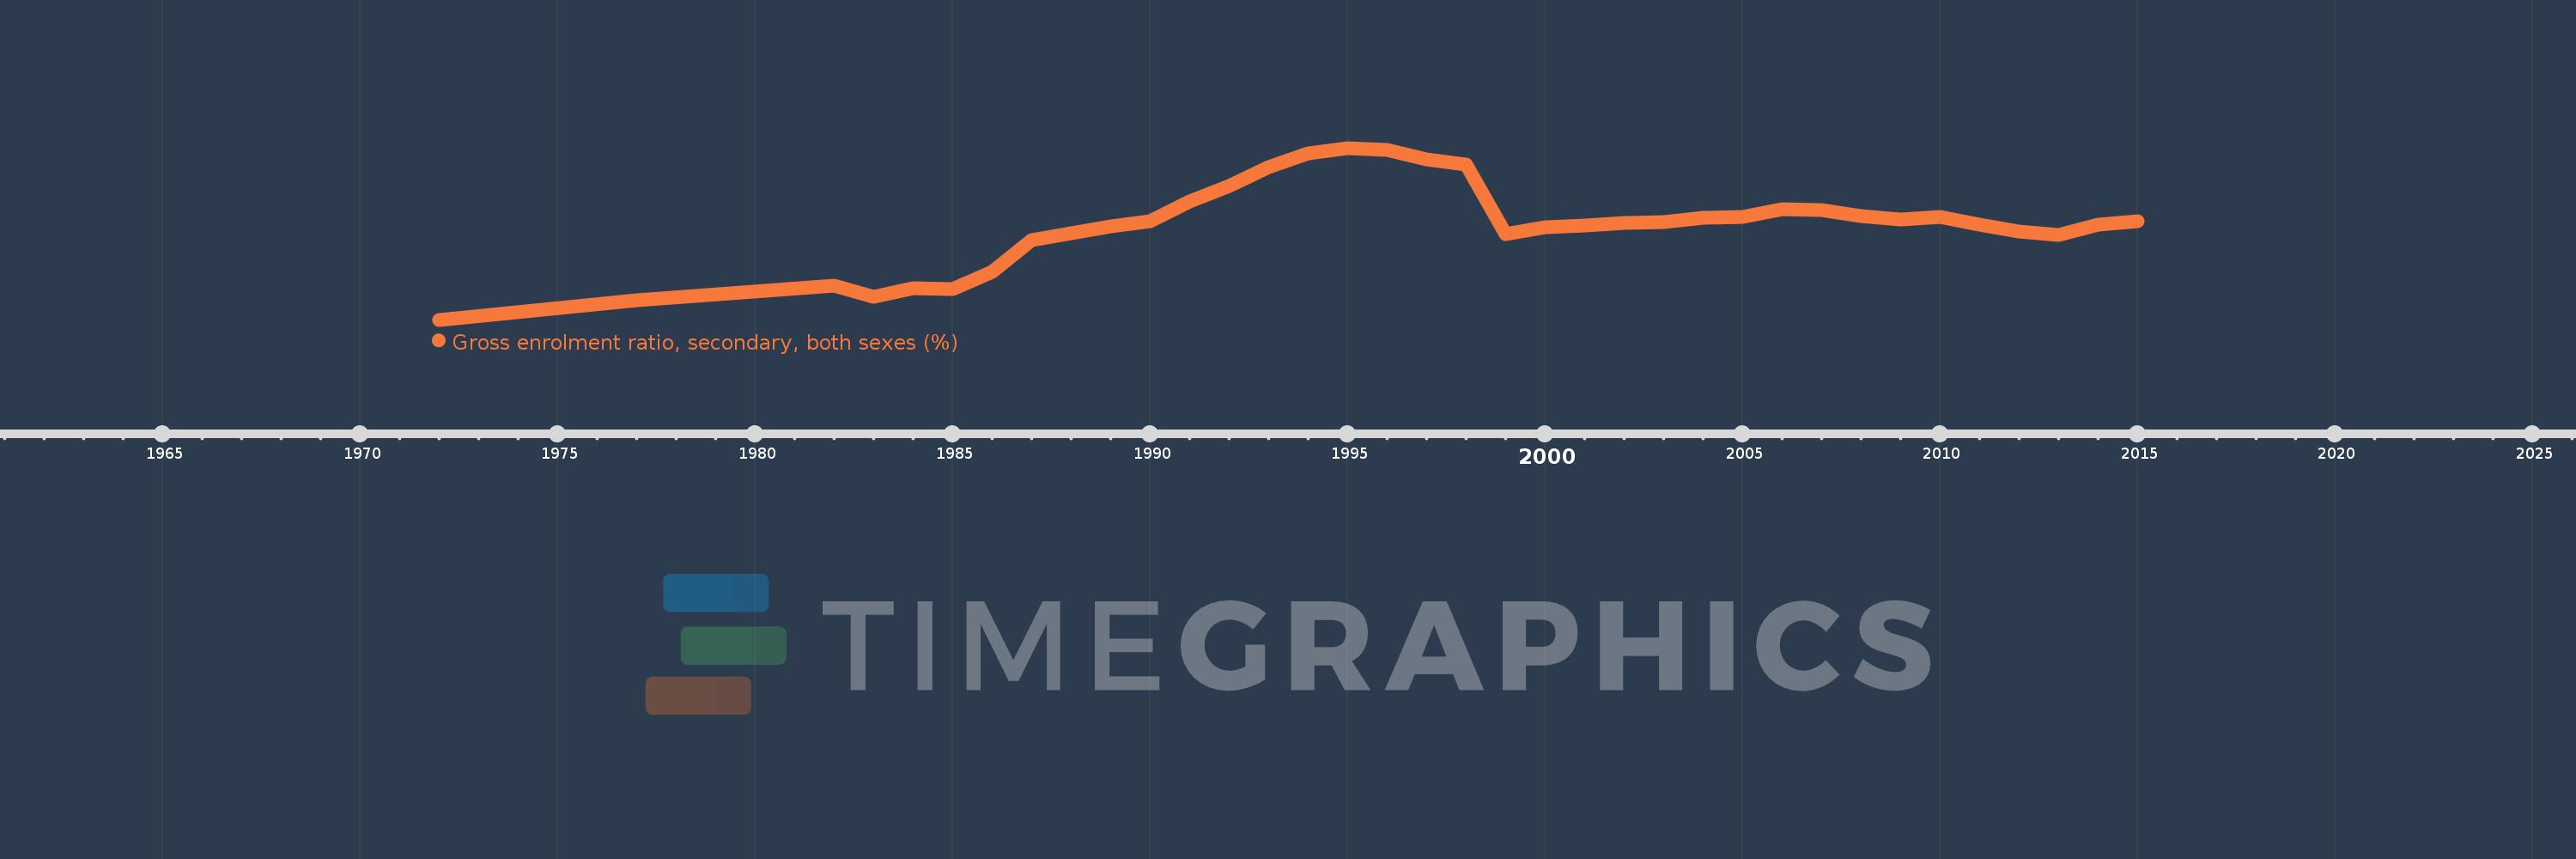
Gross enrolment ratio, secondary, both sexes (%)
2015,2014,2013,2012,2011,2010,2009,2008,2007,2006,2005,2004,2003,2002,2001,2000,1999,1998,1997,1996,1995,1994,1993,1992,1991,1990,1989,1988,1987,1986,1985,1984,1983,1982,1977,1972
This statistics in other country:
AfghanistanAlbaniaAlgeriaAndorraAngolaAntigua and BarbudaArab WorldArgentinaArmeniaArubaAustraliaAustriaAzerbaijanBahamas, TheBahrainBangladeshBarbadosBelarusBelgiumBelizeBeninBermudaBhutanBoliviaBosnia and HerzegovinaBotswanaBrazilBritish Virgin IslandsBrunei DarussalamBulgariaBurkina FasoBurundiCabo VerdeCambodiaCameroonCanadaCaribbean small statesCentral African RepublicCentral Europe and the BalticsChadChileChinaColombiaComorosCongo, Dem. Rep.Congo, Rep.Costa RicaCote d'IvoireCroatiaCubaCuracaoCyprusCzech RepublicDenmarkDjiboutiDominicaDominican RepublicEarly-demographic dividendEast Asia & PacificEast Asia & Pacific (excluding high income)East Asia & Pacific (IDA & IBRD countries)EcuadorEgypt, Arab Rep.El SalvadorEquatorial GuineaEritreaEstoniaEthiopiaEuro areaEurope & Central AsiaEurope & Central Asia (excluding high income)Europe & Central Asia (IDA & IBRD countries)European UnionFijiFinlandFragile and conflict affected situationsFranceGabonGambia, TheGeorgiaGermanyGhanaGreeceGrenadaGuatemalaGuineaGuinea-BissauGuyanaHaitiHeavily indebted poor countries (HIPC)High incomeHondurasHong Kong SAR, ChinaHungaryIBRD onlyIcelandIDA & IBRD totalIDA blendIDA onlyIDA totalIndiaIndonesiaIran, Islamic Rep.IraqIrelandIsraelItalyJamaicaJapanJordanKazakhstanKenyaKiribatiKorea, Dem. People’s Rep.Korea, Rep.KuwaitKyrgyz RepublicLao PDRLate-demographic dividendLatin America & Caribbean Latin America & Caribbean (excluding high income)Latin America & the Caribbean (IDA & IBRD countries)LatviaLeast developed countries: UN classificationLebanonLesothoLiberiaLibyaLiechtensteinLithuaniaLow & middle incomeLow incomeLower middle incomeLuxembourgMacao SAR, ChinaMacedonia, FYRMadagascarMalawiMalaysiaMaldivesMaliMaltaMarshall IslandsMauritaniaMauritiusMexicoMicronesia, Fed. Sts.Middle East & North AfricaMiddle East & North Africa (excluding high income)Middle East & North Africa (IDA & IBRD countries)Middle incomeMoldovaMongoliaMontenegroMoroccoMozambiqueMyanmarNamibiaNauruNepalNetherlandsNew ZealandNicaraguaNigerNigeriaNorth AmericaNorwayOECD membersOmanOther small statesPacific island small statesPakistanPalauPanamaPapua New GuineaParaguayPeruPhilippinesPolandPortugalPost-demographic dividendPre-demographic dividendPuerto RicoQatarRomaniaRussian FederationRwandaSamoaSan MarinoSao Tome and PrincipeSaudi ArabiaSenegalSerbiaSeychellesSierra LeoneSlovak RepublicSloveniaSmall statesSolomon IslandsSomaliaSouth AfricaSouth AsiaSouth Asia (IDA & IBRD)SpainSri LankaSt. Kitts and NevisSt. LuciaSt. Vincent and the GrenadinesSub-Saharan Africa Sub-Saharan Africa (excluding high income)Sub-Saharan Africa (IDA & IBRD countries)SudanSurinameSwazilandSwedenSwitzerlandSyrian Arab RepublicTajikistanTanzaniaThailandTimor-LesteTogoTongaTrinidad and TobagoTunisiaTurkeyTurkmenistanTuvaluUgandaUkraineUnited Arab EmiratesUnited KingdomUnited StatesUpper middle incomeUruguayUzbekistanVanuatuVenezuela, RBVietnamWest Bank and GazaWorldYemen, Rep.ZambiaZimbabwe Timeline:
This timeline shows a graph from 1972 to 2015 of Austria. No data until 1971. Number of actual observations by date: 36.
Source name:
World Development Indicators
Source organization:
UNESCO Institute for Statistics
Categories, topics:
Education
Last updated:
apr 23, 2017
Indicators value changes by year
Minimum:
88.844
jan 1, 1972
Maximum:
107.011
jan 1, 1995
At the date of observation
Value
Absolute change
Change from previous value
jan 1, 1972
88.844
+88.844
0.0%
jan 1, 1977
90.862
+2.018
2.27%
jan 1, 1982
92.495
+1.634
1.8%
jan 1, 1983
91.292
-1.203
-1.3%
jan 1, 1984
92.209
+0.917
1.0%
jan 1, 1985
92.086
-0.123
-0.13%
jan 1, 1986
93.906
+1.82
1.98%
jan 1, 1987
97.24
+3.335
3.55%
jan 1, 1988
98.031
+0.791
0.81%
jan 1, 1989
98.713
+0.682
0.7%
jan 1, 1990
99.221
+0.508
0.51%
jan 1, 1991
101.359
+2.138
2.15%
jan 1, 1992
102.994
+1.635
1.61%
jan 1, 1993
104.998
+2.004
1.95%
jan 1, 1994
106.483
+1.485
1.41%
jan 1, 1995
107.011
+0.528
0.5%
jan 1, 1996
106.768
-0.244
-0.23%
jan 1, 1997
105.828
-0.939
-0.88%
jan 1, 1998
105.287
-0.541
-0.51%
jan 1, 1999
97.892
-7.395
-7.02%
jan 1, 2000
98.592
+0.7
0.72%
jan 1, 2001
98.846
+0.254
0.26%
jan 1, 2002
99.109
+0.263
0.27%
jan 1, 2003
99.163
+0.054
0.05%
jan 1, 2004
99.625
+0.462
0.47%
jan 1, 2005
99.679
+0.054
0.05%
jan 1, 2006
100.513
+0.833
0.84%
jan 1, 2007
100.473
-0.04
-0.04%
jan 1, 2008
99.807
-0.666
-0.66%
jan 1, 2009
99.481
-0.326
-0.33%
jan 1, 2010
99.689
+0.207
0.21%
jan 1, 2011
98.862
-0.826
-0.83%
jan 1, 2012
98.193
-0.669
-0.68%
jan 1, 2013
97.784
-0.409
-0.42%
jan 1, 2014
98.936
+1.152
1.18%
jan 1, 2015
99.296
+0.36
0.36%
Ranking of countries by current statistics by years


Comments: