29
/
en
AIzaSyAYiBZKx7MnpbEhh9jyipgxe19OcubqV5w
April 1, 2024
24931
Caribbean small states
CSS
false
2
1
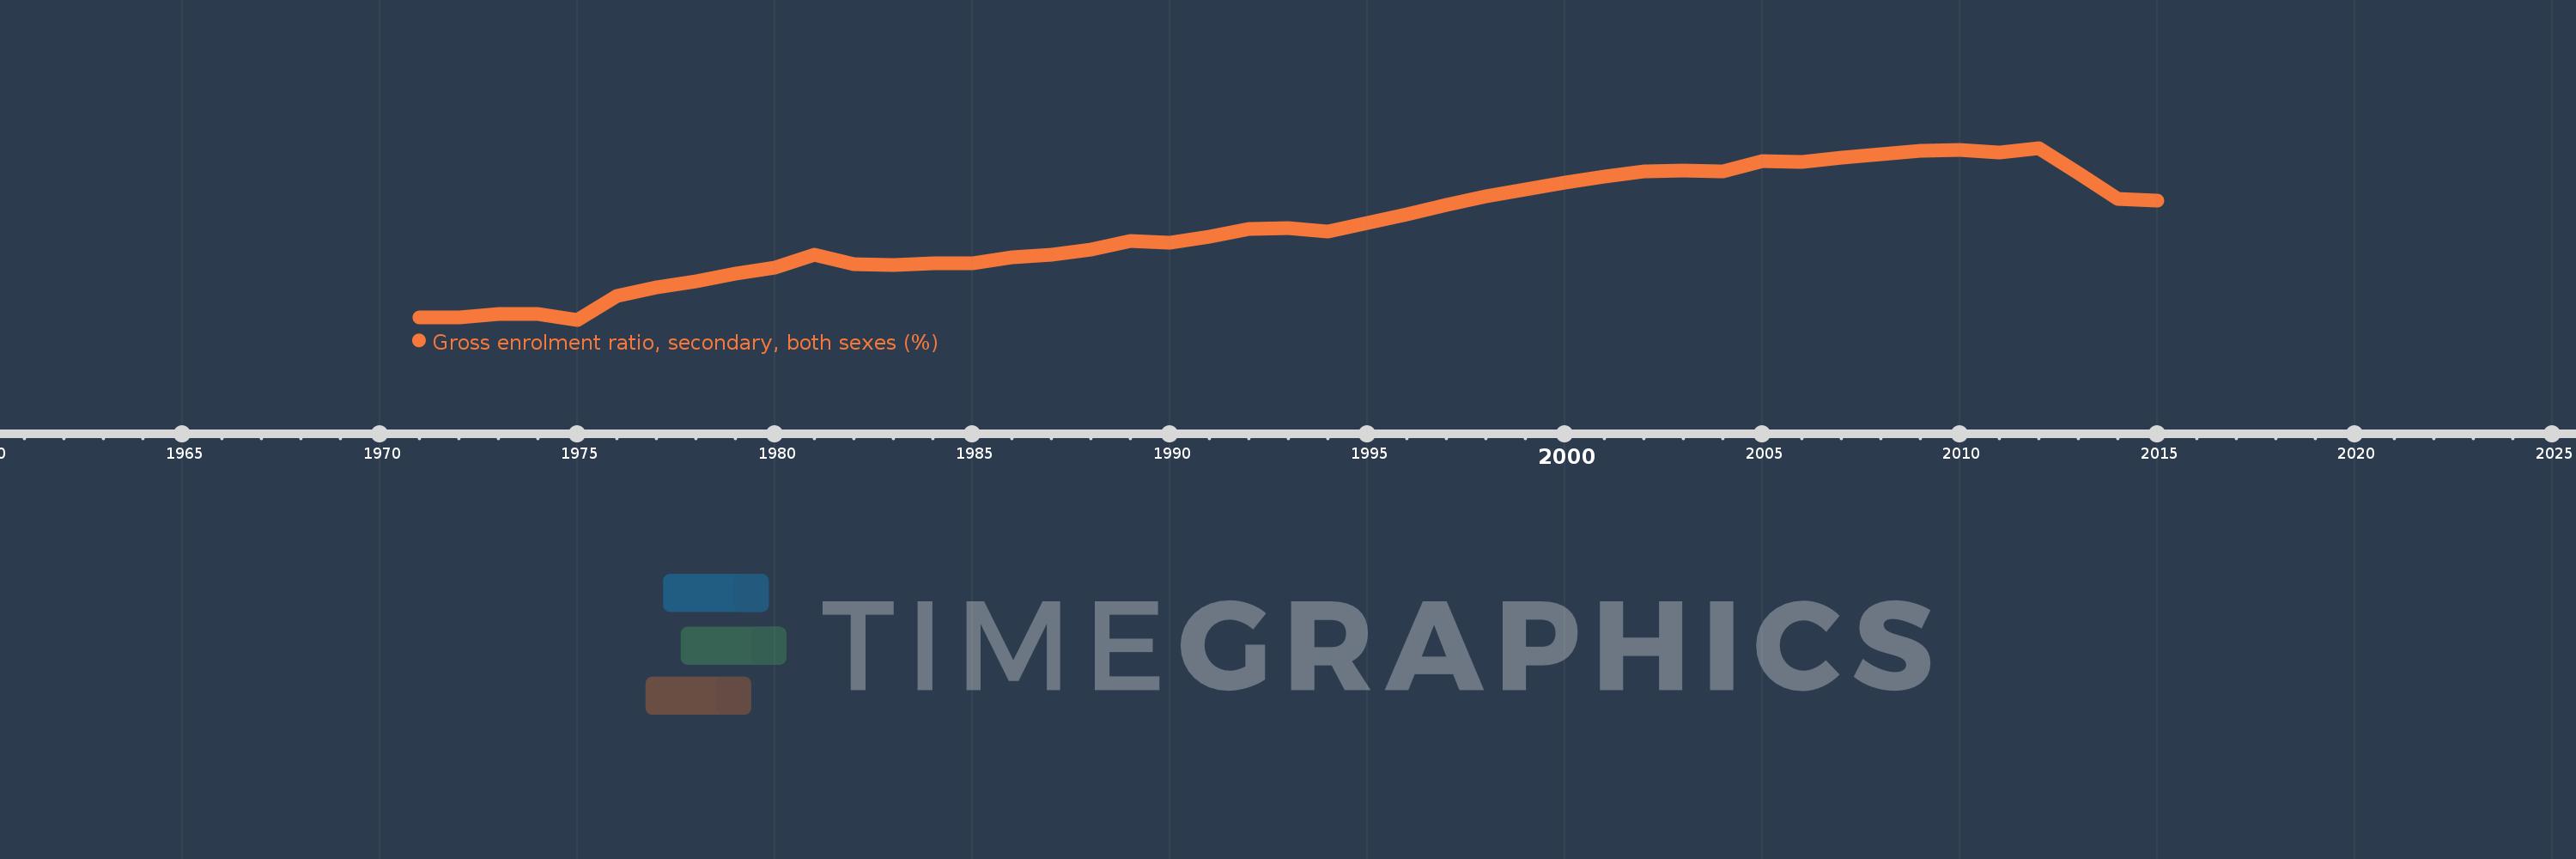
Gross enrolment ratio, secondary, both sexes (%)
2015,2014,2013,2012,2011,2010,2009,2008,2007,2006,2005,2004,2003,2002,2001,2000,1999,1998,1997,1996,1995,1994,1993,1992,1991,1990,1989,1988,1987,1986,1985,1984,1983,1982,1981,1980,1979,1978,1977,1976,1975,1974,1973,1972,1971
This statistics in other country:
AfghanistanAlbaniaAlgeriaAndorraAngolaAntigua and BarbudaArab WorldArgentinaArmeniaArubaAustraliaAustriaAzerbaijanBahamas, TheBahrainBangladeshBarbadosBelarusBelgiumBelizeBeninBermudaBhutanBoliviaBosnia and HerzegovinaBotswanaBrazilBritish Virgin IslandsBrunei DarussalamBulgariaBurkina FasoBurundiCabo VerdeCambodiaCameroonCanadaCaribbean small statesCentral African RepublicCentral Europe and the BalticsChadChileChinaColombiaComorosCongo, Dem. Rep.Congo, Rep.Costa RicaCote d'IvoireCroatiaCubaCuracaoCyprusCzech RepublicDenmarkDjiboutiDominicaDominican RepublicEarly-demographic dividendEast Asia & PacificEast Asia & Pacific (excluding high income)East Asia & Pacific (IDA & IBRD countries)EcuadorEgypt, Arab Rep.El SalvadorEquatorial GuineaEritreaEstoniaEthiopiaEuro areaEurope & Central AsiaEurope & Central Asia (excluding high income)Europe & Central Asia (IDA & IBRD countries)European UnionFijiFinlandFragile and conflict affected situationsFranceGabonGambia, TheGeorgiaGermanyGhanaGreeceGrenadaGuatemalaGuineaGuinea-BissauGuyanaHaitiHeavily indebted poor countries (HIPC)High incomeHondurasHong Kong SAR, ChinaHungaryIBRD onlyIcelandIDA & IBRD totalIDA blendIDA onlyIDA totalIndiaIndonesiaIran, Islamic Rep.IraqIrelandIsraelItalyJamaicaJapanJordanKazakhstanKenyaKiribatiKorea, Dem. People’s Rep.Korea, Rep.KuwaitKyrgyz RepublicLao PDRLate-demographic dividendLatin America & Caribbean Latin America & Caribbean (excluding high income)Latin America & the Caribbean (IDA & IBRD countries)LatviaLeast developed countries: UN classificationLebanonLesothoLiberiaLibyaLiechtensteinLithuaniaLow & middle incomeLow incomeLower middle incomeLuxembourgMacao SAR, ChinaMacedonia, FYRMadagascarMalawiMalaysiaMaldivesMaliMaltaMarshall IslandsMauritaniaMauritiusMexicoMicronesia, Fed. Sts.Middle East & North AfricaMiddle East & North Africa (excluding high income)Middle East & North Africa (IDA & IBRD countries)Middle incomeMoldovaMongoliaMontenegroMoroccoMozambiqueMyanmarNamibiaNauruNepalNetherlandsNew ZealandNicaraguaNigerNigeriaNorth AmericaNorwayOECD membersOmanOther small statesPacific island small statesPakistanPalauPanamaPapua New GuineaParaguayPeruPhilippinesPolandPortugalPost-demographic dividendPre-demographic dividendPuerto RicoQatarRomaniaRussian FederationRwandaSamoaSan MarinoSao Tome and PrincipeSaudi ArabiaSenegalSerbiaSeychellesSierra LeoneSlovak RepublicSloveniaSmall statesSolomon IslandsSomaliaSouth AfricaSouth AsiaSouth Asia (IDA & IBRD)SpainSri LankaSt. Kitts and NevisSt. LuciaSt. Vincent and the GrenadinesSub-Saharan Africa Sub-Saharan Africa (excluding high income)Sub-Saharan Africa (IDA & IBRD countries)SudanSurinameSwazilandSwedenSwitzerlandSyrian Arab RepublicTajikistanTanzaniaThailandTimor-LesteTogoTongaTrinidad and TobagoTunisiaTurkeyTurkmenistanTuvaluUgandaUkraineUnited Arab EmiratesUnited KingdomUnited StatesUpper middle incomeUruguayUzbekistanVanuatuVenezuela, RBVietnamWest Bank and GazaWorldYemen, Rep.ZambiaZimbabwe Timeline:
This timeline shows a graph from 1971 to 2015 of Caribbean small states. No data until 1970. Number of actual observations by date: 45.
Source name:
World Development Indicators
Source organization:
UNESCO Institute for Statistics
Categories, topics:
Education
Last updated:
apr 23, 2017
Indicators value changes by year
Minimum:
52.811
jan 1, 1975
Maximum:
91.002
jan 1, 2012
At the date of observation
Value
Absolute change
Change from previous value
jan 1, 1971
53.262
+53.262
0.0%
jan 1, 1972
53.249
-0.013
-0.02%
jan 1, 1973
54.156
+0.907
1.7%
jan 1, 1974
54.137
-0.019
-0.03%
jan 1, 1975
52.811
-1.326
-2.45%
jan 1, 1976
58.186
+5.375
10.18%
jan 1, 1977
60.019
+1.833
3.15%
jan 1, 1978
61.408
+1.389
2.31%
jan 1, 1979
63.012
+1.604
2.61%
jan 1, 1980
64.443
+1.431
2.27%
jan 1, 1981
67.203
+2.76
4.28%
jan 1, 1982
65.136
-2.067
-3.08%
jan 1, 1983
65.012
-0.124
-0.19%
jan 1, 1984
65.444
+0.433
0.67%
jan 1, 1985
65.355
-0.089
-0.14%
jan 1, 1986
66.704
+1.349
2.06%
jan 1, 1987
67.298
+0.594
0.89%
jan 1, 1988
68.48
+1.183
1.76%
jan 1, 1989
70.373
+1.893
2.76%
jan 1, 1990
69.976
-0.397
-0.56%
jan 1, 1991
71.361
+1.385
1.98%
jan 1, 1992
72.923
+1.562
2.19%
jan 1, 1993
73.281
+0.357
0.49%
jan 1, 1994
72.338
-0.943
-1.29%
jan 1, 1995
74.359
+2.021
2.79%
jan 1, 1996
76.336
+1.977
2.66%
jan 1, 1997
78.295
+1.959
2.57%
jan 1, 1998
80.178
+1.883
2.41%
jan 1, 1999
81.775
+1.597
1.99%
jan 1, 2000
83.339
+1.565
1.91%
jan 1, 2001
84.588
+1.249
1.5%
jan 1, 2002
85.874
+1.286
1.52%
jan 1, 2003
85.987
+0.113
0.13%
jan 1, 2004
85.822
-0.165
-0.19%
jan 1, 2005
88.038
+2.216
2.58%
jan 1, 2006
87.832
-0.207
-0.23%
jan 1, 2007
88.871
+1.039
1.18%
jan 1, 2008
89.679
+0.808
0.91%
jan 1, 2009
90.406
+0.727
0.81%
jan 1, 2010
90.562
+0.156
0.17%
jan 1, 2011
90.046
-0.516
-0.57%
jan 1, 2012
91.002
+0.956
1.06%
jan 1, 2013
85.318
-5.683
-6.25%
jan 1, 2014
79.585
-5.733
-6.72%
jan 1, 2015
79.326
-0.259
-0.33%
Ranking of countries by current statistics by years


Comments: