29
/
en
AIzaSyAYiBZKx7MnpbEhh9jyipgxe19OcubqV5w
April 1, 2024
262301
Thailand
THA
true
2
1
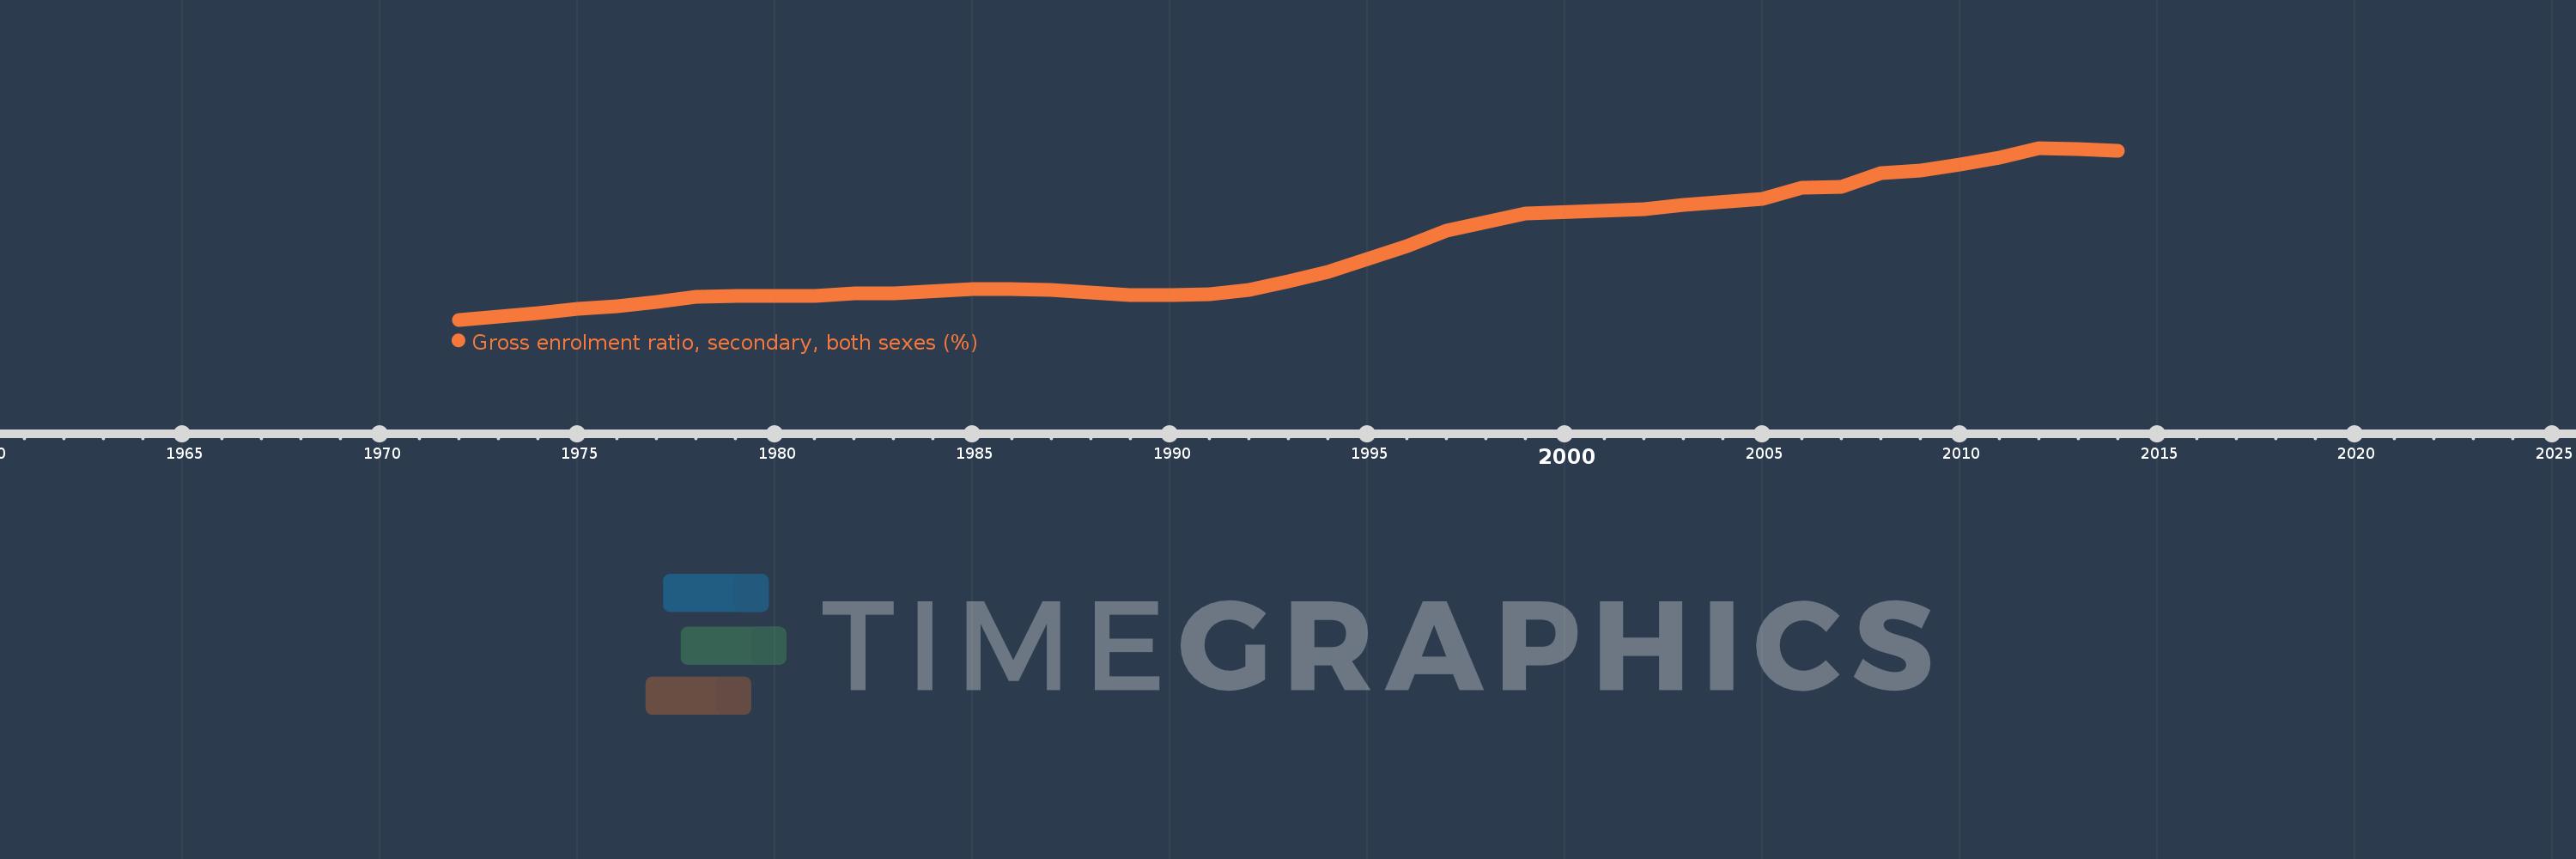
Gross enrolment ratio, secondary, both sexes (%)
2014,2013,2012,2011,2010,2009,2008,2007,2006,2005,2003,2002,1999,1998,1997,1996,1995,1994,1993,1992,1991,1990,1989,1988,1987,1986,1985,1983,1982,1981,1980,1979,1978,1977,1976,1975,1974,1973,1972
This statistics in other country:
AfghanistanAlbaniaAlgeriaAndorraAngolaAntigua and BarbudaArab WorldArgentinaArmeniaArubaAustraliaAustriaAzerbaijanBahamas, TheBahrainBangladeshBarbadosBelarusBelgiumBelizeBeninBermudaBhutanBoliviaBosnia and HerzegovinaBotswanaBrazilBritish Virgin IslandsBrunei DarussalamBulgariaBurkina FasoBurundiCabo VerdeCambodiaCameroonCanadaCaribbean small statesCentral African RepublicCentral Europe and the BalticsChadChileChinaColombiaComorosCongo, Dem. Rep.Congo, Rep.Costa RicaCote d'IvoireCroatiaCubaCuracaoCyprusCzech RepublicDenmarkDjiboutiDominicaDominican RepublicEarly-demographic dividendEast Asia & PacificEast Asia & Pacific (excluding high income)East Asia & Pacific (IDA & IBRD countries)EcuadorEgypt, Arab Rep.El SalvadorEquatorial GuineaEritreaEstoniaEthiopiaEuro areaEurope & Central AsiaEurope & Central Asia (excluding high income)Europe & Central Asia (IDA & IBRD countries)European UnionFijiFinlandFragile and conflict affected situationsFranceGabonGambia, TheGeorgiaGermanyGhanaGreeceGrenadaGuatemalaGuineaGuinea-BissauGuyanaHaitiHeavily indebted poor countries (HIPC)High incomeHondurasHong Kong SAR, ChinaHungaryIBRD onlyIcelandIDA & IBRD totalIDA blendIDA onlyIDA totalIndiaIndonesiaIran, Islamic Rep.IraqIrelandIsraelItalyJamaicaJapanJordanKazakhstanKenyaKiribatiKorea, Dem. People’s Rep.Korea, Rep.KuwaitKyrgyz RepublicLao PDRLate-demographic dividendLatin America & Caribbean Latin America & Caribbean (excluding high income)Latin America & the Caribbean (IDA & IBRD countries)LatviaLeast developed countries: UN classificationLebanonLesothoLiberiaLibyaLiechtensteinLithuaniaLow & middle incomeLow incomeLower middle incomeLuxembourgMacao SAR, ChinaMacedonia, FYRMadagascarMalawiMalaysiaMaldivesMaliMaltaMarshall IslandsMauritaniaMauritiusMexicoMicronesia, Fed. Sts.Middle East & North AfricaMiddle East & North Africa (excluding high income)Middle East & North Africa (IDA & IBRD countries)Middle incomeMoldovaMongoliaMontenegroMoroccoMozambiqueMyanmarNamibiaNauruNepalNetherlandsNew ZealandNicaraguaNigerNigeriaNorth AmericaNorwayOECD membersOmanOther small statesPacific island small statesPakistanPalauPanamaPapua New GuineaParaguayPeruPhilippinesPolandPortugalPost-demographic dividendPre-demographic dividendPuerto RicoQatarRomaniaRussian FederationRwandaSamoaSan MarinoSao Tome and PrincipeSaudi ArabiaSenegalSerbiaSeychellesSierra LeoneSlovak RepublicSloveniaSmall statesSolomon IslandsSomaliaSouth AfricaSouth AsiaSouth Asia (IDA & IBRD)SpainSri LankaSt. Kitts and NevisSt. LuciaSt. Vincent and the GrenadinesSub-Saharan Africa Sub-Saharan Africa (excluding high income)Sub-Saharan Africa (IDA & IBRD countries)SudanSurinameSwazilandSwedenSwitzerlandSyrian Arab RepublicTajikistanTanzaniaThailandTimor-LesteTogoTongaTrinidad and TobagoTunisiaTurkeyTurkmenistanTuvaluUgandaUkraineUnited Arab EmiratesUnited KingdomUnited StatesUpper middle incomeUruguayUzbekistanVanuatuVenezuela, RBVietnamWest Bank and GazaWorldYemen, Rep.ZambiaZimbabwe Timeline:
This timeline shows a graph from 1972 to 2014 of Thailand. No data until 1971. Number of actual observations by date: 39.
Source name:
World Development Indicators
Source organization:
UNESCO Institute for Statistics
Categories, topics:
Education
Last updated:
apr 23, 2017
Indicators value changes by year
Minimum:
18.125
jan 1, 1972
Maximum:
87.444
jan 1, 2012
At the date of observation
Value
Absolute change
Change from previous value
jan 1, 1972
18.125
+18.125
0.0%
jan 1, 1973
19.289
+1.165
6.42%
jan 1, 1974
20.767
+1.477
7.66%
jan 1, 1975
22.518
+1.752
8.44%
jan 1, 1976
23.519
+1.001
4.45%
jan 1, 1977
25.413
+1.894
8.05%
jan 1, 1978
27.267
+1.853
7.29%
jan 1, 1979
27.67
+0.404
1.48%
jan 1, 1980
27.574
-0.096
-0.35%
jan 1, 1981
27.778
+0.204
0.74%
jan 1, 1982
28.618
+0.841
3.03%
jan 1, 1983
28.883
+0.265
0.92%
jan 1, 1985
30.356
+1.473
5.1%
jan 1, 1986
30.636
+0.28
0.92%
jan 1, 1987
30.153
-0.483
-1.58%
jan 1, 1988
29.271
-0.881
-2.92%
jan 1, 1989
28.163
-1.108
-3.79%
jan 1, 1990
27.9
-0.263
-0.93%
jan 1, 1991
28.505
+0.605
2.17%
jan 1, 1992
30.254
+1.749
6.14%
jan 1, 1993
33.464
+3.21
10.61%
jan 1, 1994
37.602
+4.138
12.37%
jan 1, 1995
42.584
+4.983
13.25%
jan 1, 1996
47.837
+5.253
12.33%
jan 1, 1997
54.218
+6.381
13.34%
jan 1, 1998
57.527
+3.309
6.1%
jan 1, 1999
61.17
+3.643
6.33%
jan 1, 2002
62.794
+1.624
2.66%
jan 1, 2003
64.548
+1.754
2.79%
jan 1, 2005
66.889
+2.341
3.63%
jan 1, 2006
71.56
+4.671
6.98%
jan 1, 2007
71.762
+0.203
0.28%
jan 1, 2008
77.442
+5.68
7.91%
jan 1, 2009
78.224
+0.782
1.01%
jan 1, 2010
80.853
+2.629
3.36%
jan 1, 2011
83.621
+2.769
3.42%
jan 1, 2012
87.444
+3.823
4.57%
jan 1, 2013
87.124
-0.32
-0.37%
jan 1, 2014
86.206
-0.919
-1.05%
Ranking of countries by current statistics by years


Comments: