29
/
en
AIzaSyAYiBZKx7MnpbEhh9jyipgxe19OcubqV5w
April 1, 2024
169965
Korea, Rep.
KOR
true
2
1
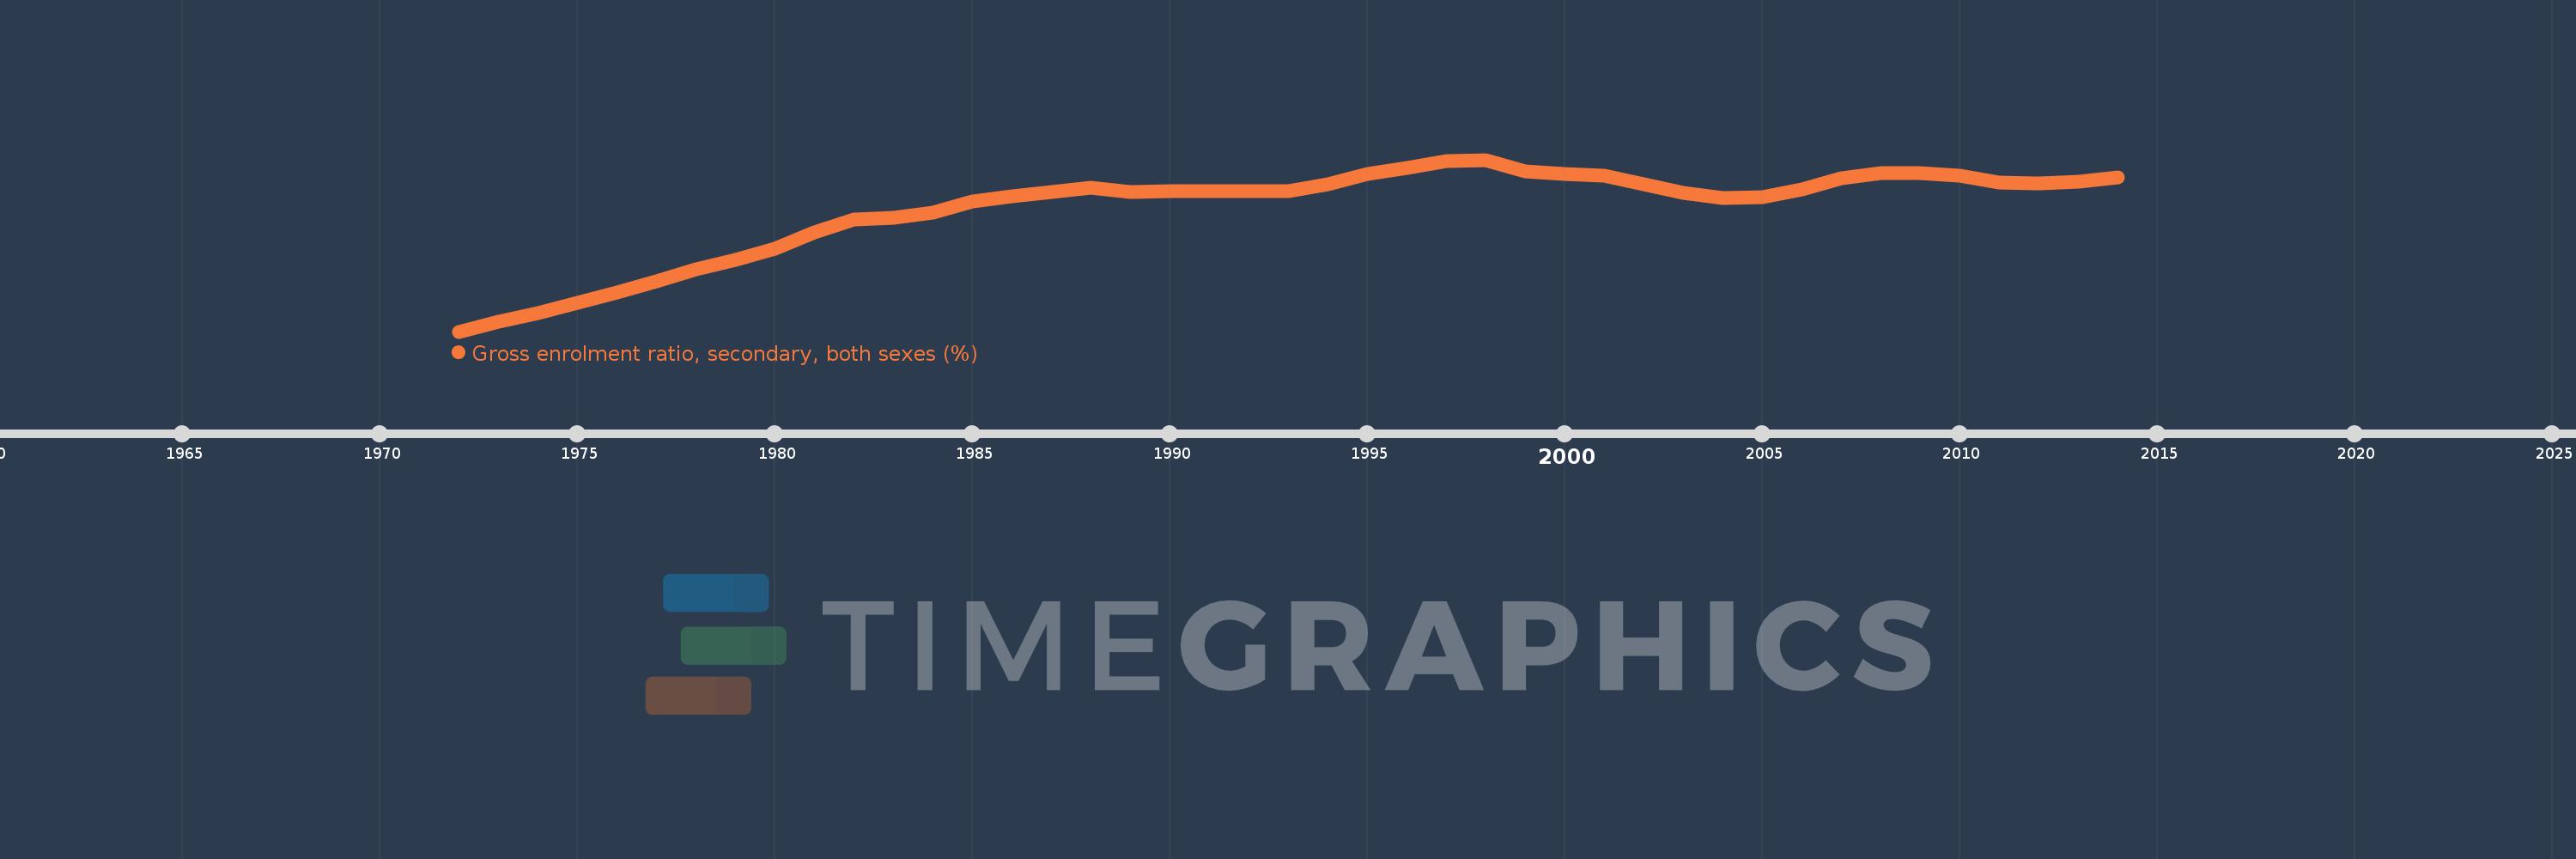
Gross enrolment ratio, secondary, both sexes (%)
2014,2013,2012,2011,2010,2009,2008,2007,2006,2005,2004,2003,2002,2001,2000,1999,1998,1997,1996,1995,1994,1993,1992,1991,1990,1989,1988,1987,1986,1985,1984,1983,1982,1981,1980,1979,1978,1977,1976,1975,1974,1973,1972
This statistics in other country:
AfghanistanAlbaniaAlgeriaAndorraAngolaAntigua and BarbudaArab WorldArgentinaArmeniaArubaAustraliaAustriaAzerbaijanBahamas, TheBahrainBangladeshBarbadosBelarusBelgiumBelizeBeninBermudaBhutanBoliviaBosnia and HerzegovinaBotswanaBrazilBritish Virgin IslandsBrunei DarussalamBulgariaBurkina FasoBurundiCabo VerdeCambodiaCameroonCanadaCaribbean small statesCentral African RepublicCentral Europe and the BalticsChadChileChinaColombiaComorosCongo, Dem. Rep.Congo, Rep.Costa RicaCote d'IvoireCroatiaCubaCuracaoCyprusCzech RepublicDenmarkDjiboutiDominicaDominican RepublicEarly-demographic dividendEast Asia & PacificEast Asia & Pacific (excluding high income)East Asia & Pacific (IDA & IBRD countries)EcuadorEgypt, Arab Rep.El SalvadorEquatorial GuineaEritreaEstoniaEthiopiaEuro areaEurope & Central AsiaEurope & Central Asia (excluding high income)Europe & Central Asia (IDA & IBRD countries)European UnionFijiFinlandFragile and conflict affected situationsFranceGabonGambia, TheGeorgiaGermanyGhanaGreeceGrenadaGuatemalaGuineaGuinea-BissauGuyanaHaitiHeavily indebted poor countries (HIPC)High incomeHondurasHong Kong SAR, ChinaHungaryIBRD onlyIcelandIDA & IBRD totalIDA blendIDA onlyIDA totalIndiaIndonesiaIran, Islamic Rep.IraqIrelandIsraelItalyJamaicaJapanJordanKazakhstanKenyaKiribatiKorea, Dem. People’s Rep.Korea, Rep.KuwaitKyrgyz RepublicLao PDRLate-demographic dividendLatin America & Caribbean Latin America & Caribbean (excluding high income)Latin America & the Caribbean (IDA & IBRD countries)LatviaLeast developed countries: UN classificationLebanonLesothoLiberiaLibyaLiechtensteinLithuaniaLow & middle incomeLow incomeLower middle incomeLuxembourgMacao SAR, ChinaMacedonia, FYRMadagascarMalawiMalaysiaMaldivesMaliMaltaMarshall IslandsMauritaniaMauritiusMexicoMicronesia, Fed. Sts.Middle East & North AfricaMiddle East & North Africa (excluding high income)Middle East & North Africa (IDA & IBRD countries)Middle incomeMoldovaMongoliaMontenegroMoroccoMozambiqueMyanmarNamibiaNauruNepalNetherlandsNew ZealandNicaraguaNigerNigeriaNorth AmericaNorwayOECD membersOmanOther small statesPacific island small statesPakistanPalauPanamaPapua New GuineaParaguayPeruPhilippinesPolandPortugalPost-demographic dividendPre-demographic dividendPuerto RicoQatarRomaniaRussian FederationRwandaSamoaSan MarinoSao Tome and PrincipeSaudi ArabiaSenegalSerbiaSeychellesSierra LeoneSlovak RepublicSloveniaSmall statesSolomon IslandsSomaliaSouth AfricaSouth AsiaSouth Asia (IDA & IBRD)SpainSri LankaSt. Kitts and NevisSt. LuciaSt. Vincent and the GrenadinesSub-Saharan Africa Sub-Saharan Africa (excluding high income)Sub-Saharan Africa (IDA & IBRD countries)SudanSurinameSwazilandSwedenSwitzerlandSyrian Arab RepublicTajikistanTanzaniaThailandTimor-LesteTogoTongaTrinidad and TobagoTunisiaTurkeyTurkmenistanTuvaluUgandaUkraineUnited Arab EmiratesUnited KingdomUnited StatesUpper middle incomeUruguayUzbekistanVanuatuVenezuela, RBVietnamWest Bank and GazaWorldYemen, Rep.ZambiaZimbabwe Timeline:
This timeline shows a graph from 1972 to 2014 of Korea, Rep.. No data until 1971. Number of actual observations by date: 43.
Source name:
World Development Indicators
Source organization:
UNESCO Institute for Statistics
Categories, topics:
Education
Last updated:
apr 23, 2017
Indicators value changes by year
Minimum:
39.708
jan 1, 1972
Maximum:
104.263
jan 1, 1998
At the date of observation
Value
Absolute change
Change from previous value
jan 1, 1972
39.708
+39.708
0.0%
jan 1, 1973
43.293
+3.584
9.03%
jan 1, 1974
46.569
+3.276
7.57%
jan 1, 1975
50.537
+3.968
8.52%
jan 1, 1976
54.386
+3.849
7.62%
jan 1, 1977
58.693
+4.307
7.92%
jan 1, 1978
62.969
+4.276
7.29%
jan 1, 1979
66.619
+3.65
5.8%
jan 1, 1980
70.86
+4.241
6.37%
jan 1, 1981
76.845
+5.985
8.45%
jan 1, 1982
81.84
+4.995
6.5%
jan 1, 1983
82.522
+0.682
0.83%
jan 1, 1984
84.304
+1.782
2.16%
jan 1, 1985
88.676
+4.372
5.19%
jan 1, 1986
90.576
+1.9
2.14%
jan 1, 1987
92.047
+1.471
1.62%
jan 1, 1988
93.854
+1.807
1.96%
jan 1, 1989
92.157
-1.697
-1.81%
jan 1, 1990
92.49
+0.333
0.36%
jan 1, 1991
92.618
+0.128
0.14%
jan 1, 1992
92.321
-0.298
-0.32%
jan 1, 1993
92.414
+0.094
0.1%
jan 1, 1994
94.958
+2.544
2.75%
jan 1, 1995
99.028
+4.07
4.29%
jan 1, 1996
101.256
+2.228
2.25%
jan 1, 1997
103.633
+2.377
2.35%
jan 1, 1998
104.263
+0.63
0.61%
jan 1, 1999
100.003
-4.259
-4.09%
jan 1, 2000
99.071
-0.932
-0.93%
jan 1, 2001
98.393
-0.678
-0.68%
jan 1, 2002
95.187
-3.206
-3.26%
jan 1, 2003
91.867
-3.32
-3.49%
jan 1, 2004
90.008
-1.859
-2.02%
jan 1, 2005
90.168
+0.16
0.18%
jan 1, 2006
92.981
+2.813
3.12%
jan 1, 2007
97.301
+4.32
4.65%
jan 1, 2008
99.136
+1.835
1.89%
jan 1, 2009
99.184
+0.048
0.05%
jan 1, 2010
98.155
-1.029
-1.04%
jan 1, 2011
95.863
-2.293
-2.34%
jan 1, 2012
95.494
-0.369
-0.38%
jan 1, 2013
95.936
+0.442
0.46%
jan 1, 2014
97.73
+1.794
1.87%
Ranking of countries by current statistics by years


Comments: