29
/
en
AIzaSyAYiBZKx7MnpbEhh9jyipgxe19OcubqV5w
April 1, 2024
207995
Netherlands
NLD
true
2
1
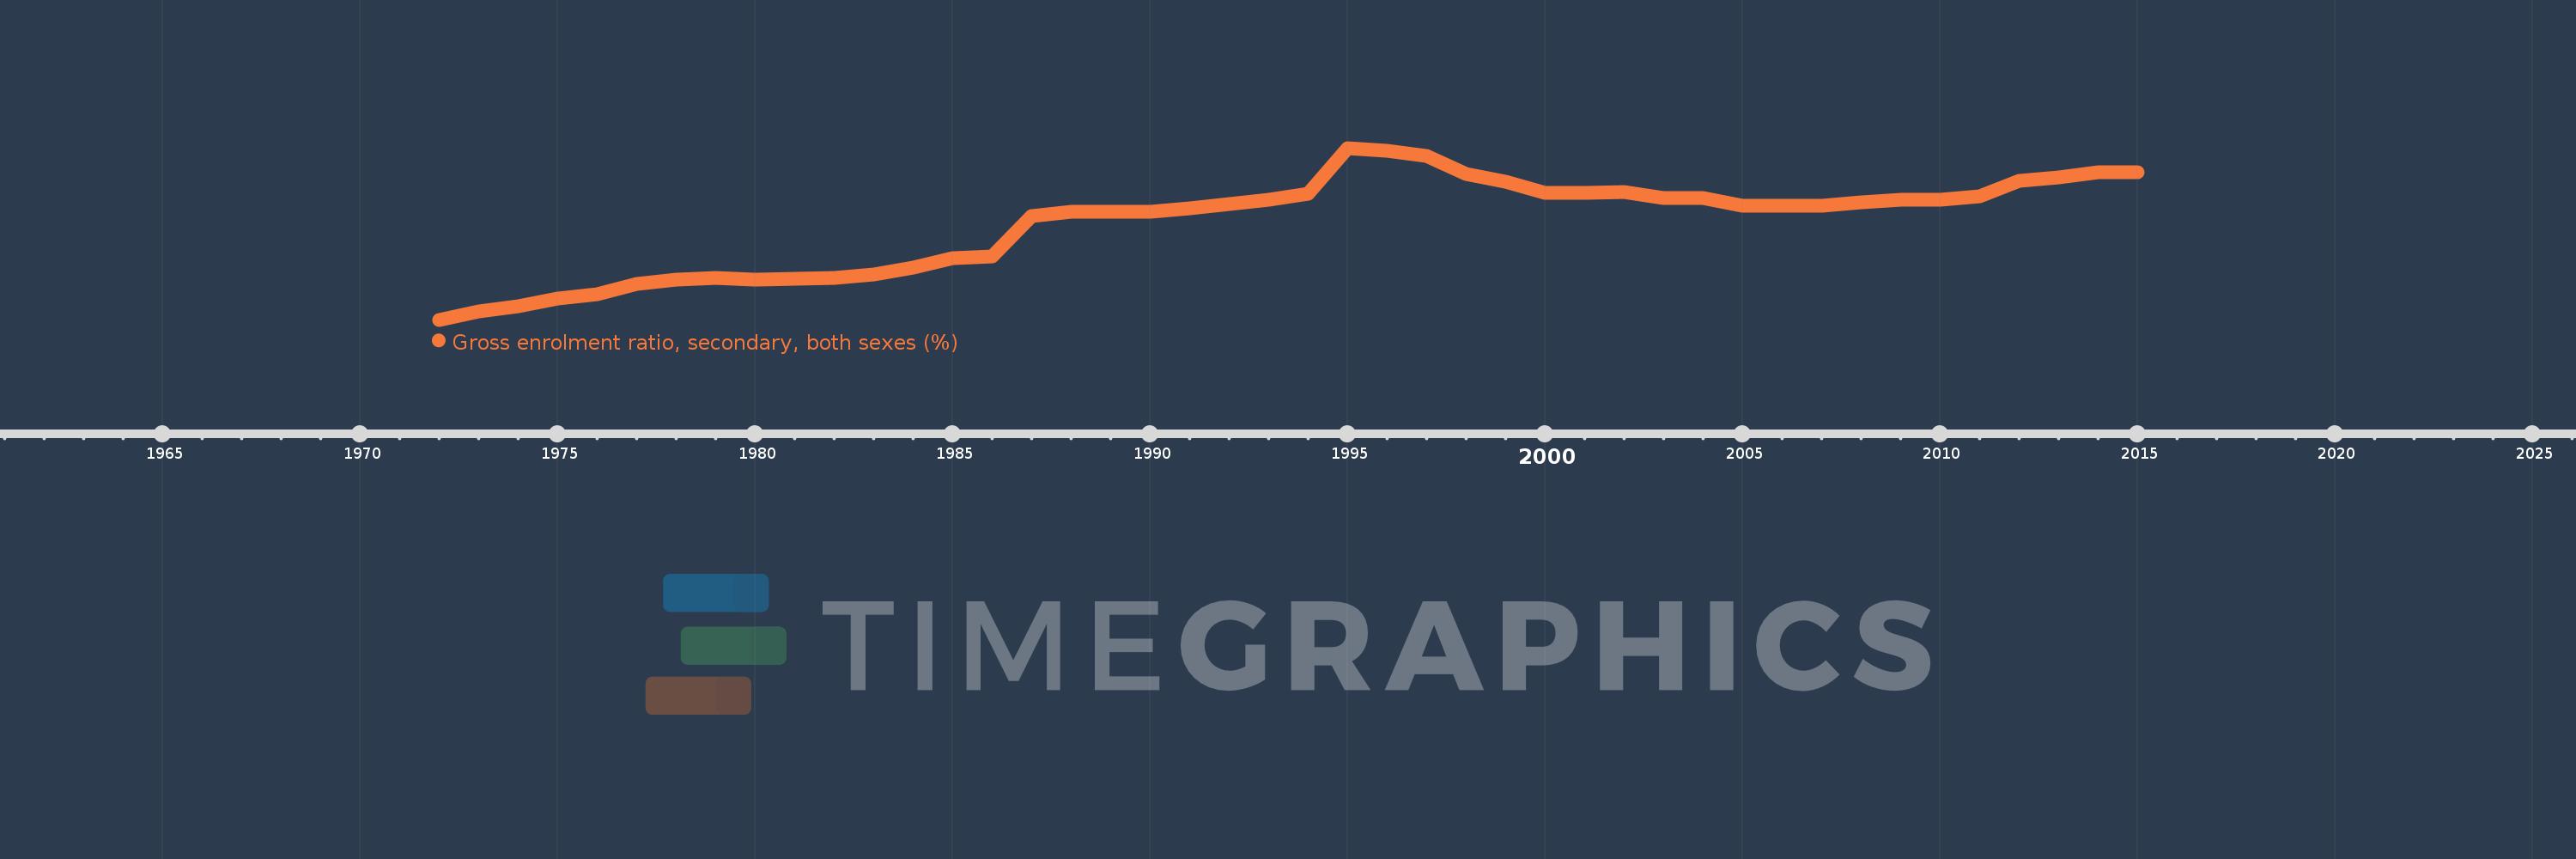
Gross enrolment ratio, secondary, both sexes (%)
2015,2014,2013,2012,2011,2010,2009,2008,2007,2006,2005,2004,2003,2002,2001,2000,1999,1998,1997,1996,1995,1994,1993,1992,1991,1990,1989,1988,1987,1986,1985,1984,1983,1982,1981,1980,1979,1978,1977,1976,1975,1974,1973,1972
This statistics in other country:
AfghanistanAlbaniaAlgeriaAndorraAngolaAntigua and BarbudaArab WorldArgentinaArmeniaArubaAustraliaAustriaAzerbaijanBahamas, TheBahrainBangladeshBarbadosBelarusBelgiumBelizeBeninBermudaBhutanBoliviaBosnia and HerzegovinaBotswanaBrazilBritish Virgin IslandsBrunei DarussalamBulgariaBurkina FasoBurundiCabo VerdeCambodiaCameroonCanadaCaribbean small statesCentral African RepublicCentral Europe and the BalticsChadChileChinaColombiaComorosCongo, Dem. Rep.Congo, Rep.Costa RicaCote d'IvoireCroatiaCubaCuracaoCyprusCzech RepublicDenmarkDjiboutiDominicaDominican RepublicEarly-demographic dividendEast Asia & PacificEast Asia & Pacific (excluding high income)East Asia & Pacific (IDA & IBRD countries)EcuadorEgypt, Arab Rep.El SalvadorEquatorial GuineaEritreaEstoniaEthiopiaEuro areaEurope & Central AsiaEurope & Central Asia (excluding high income)Europe & Central Asia (IDA & IBRD countries)European UnionFijiFinlandFragile and conflict affected situationsFranceGabonGambia, TheGeorgiaGermanyGhanaGreeceGrenadaGuatemalaGuineaGuinea-BissauGuyanaHaitiHeavily indebted poor countries (HIPC)High incomeHondurasHong Kong SAR, ChinaHungaryIBRD onlyIcelandIDA & IBRD totalIDA blendIDA onlyIDA totalIndiaIndonesiaIran, Islamic Rep.IraqIrelandIsraelItalyJamaicaJapanJordanKazakhstanKenyaKiribatiKorea, Dem. People’s Rep.Korea, Rep.KuwaitKyrgyz RepublicLao PDRLate-demographic dividendLatin America & Caribbean Latin America & Caribbean (excluding high income)Latin America & the Caribbean (IDA & IBRD countries)LatviaLeast developed countries: UN classificationLebanonLesothoLiberiaLibyaLiechtensteinLithuaniaLow & middle incomeLow incomeLower middle incomeLuxembourgMacao SAR, ChinaMacedonia, FYRMadagascarMalawiMalaysiaMaldivesMaliMaltaMarshall IslandsMauritaniaMauritiusMexicoMicronesia, Fed. Sts.Middle East & North AfricaMiddle East & North Africa (excluding high income)Middle East & North Africa (IDA & IBRD countries)Middle incomeMoldovaMongoliaMontenegroMoroccoMozambiqueMyanmarNamibiaNauruNepalNetherlandsNew ZealandNicaraguaNigerNigeriaNorth AmericaNorwayOECD membersOmanOther small statesPacific island small statesPakistanPalauPanamaPapua New GuineaParaguayPeruPhilippinesPolandPortugalPost-demographic dividendPre-demographic dividendPuerto RicoQatarRomaniaRussian FederationRwandaSamoaSan MarinoSao Tome and PrincipeSaudi ArabiaSenegalSerbiaSeychellesSierra LeoneSlovak RepublicSloveniaSmall statesSolomon IslandsSomaliaSouth AfricaSouth AsiaSouth Asia (IDA & IBRD)SpainSri LankaSt. Kitts and NevisSt. LuciaSt. Vincent and the GrenadinesSub-Saharan Africa Sub-Saharan Africa (excluding high income)Sub-Saharan Africa (IDA & IBRD countries)SudanSurinameSwazilandSwedenSwitzerlandSyrian Arab RepublicTajikistanTanzaniaThailandTimor-LesteTogoTongaTrinidad and TobagoTunisiaTurkeyTurkmenistanTuvaluUgandaUkraineUnited Arab EmiratesUnited KingdomUnited StatesUpper middle incomeUruguayUzbekistanVanuatuVenezuela, RBVietnamWest Bank and GazaWorldYemen, Rep.ZambiaZimbabwe Timeline:
This timeline shows a graph from 1972 to 2015 of Netherlands. No data until 1971. Number of actual observations by date: 44.
Source name:
World Development Indicators
Source organization:
UNESCO Institute for Statistics
Categories, topics:
Education
Last updated:
apr 23, 2017
Indicators value changes by year
Minimum:
75.545
jan 1, 1972
Maximum:
141.561
jan 1, 1995
At the date of observation
Value
Absolute change
Change from previous value
jan 1, 1972
75.545
+75.545
0.0%
jan 1, 1973
78.65
+3.105
4.11%
jan 1, 1974
80.876
+2.226
2.83%
jan 1, 1975
83.642
+2.766
3.42%
jan 1, 1976
85.361
+1.719
2.06%
jan 1, 1977
89.161
+3.8
4.45%
jan 1, 1978
90.896
+1.736
1.95%
jan 1, 1979
91.679
+0.783
0.86%
jan 1, 1980
91.086
-0.593
-0.65%
jan 1, 1981
91.409
+0.323
0.35%
jan 1, 1982
91.488
+0.08
0.09%
jan 1, 1983
93.008
+1.52
1.66%
jan 1, 1984
95.708
+2.7
2.9%
jan 1, 1985
99.103
+3.395
3.55%
jan 1, 1986
99.988
+0.885
0.89%
jan 1, 1987
115.451
+15.464
15.47%
jan 1, 1988
117.199
+1.748
1.51%
jan 1, 1989
116.974
-0.226
-0.19%
jan 1, 1990
117.102
+0.128
0.11%
jan 1, 1991
118.483
+1.381
1.18%
jan 1, 1992
119.997
+1.514
1.28%
jan 1, 1993
121.623
+1.626
1.36%
jan 1, 1994
123.903
+2.28
1.87%
jan 1, 1995
141.561
+17.658
14.25%
jan 1, 1996
140.618
-0.943
-0.67%
jan 1, 1997
138.332
-2.286
-1.63%
jan 1, 1998
131.536
-6.796
-4.91%
jan 1, 1999
128.619
-2.917
-2.22%
jan 1, 2000
124.344
-4.275
-3.32%
jan 1, 2001
124.155
-0.189
-0.15%
jan 1, 2002
124.62
+0.465
0.37%
jan 1, 2003
122.313
-2.306
-1.85%
jan 1, 2004
122.21
-0.103
-0.08%
jan 1, 2005
119.28
-2.93
-2.4%
jan 1, 2006
119.33
+0.05
0.04%
jan 1, 2007
119.494
+0.164
0.14%
jan 1, 2008
120.566
+1.072
0.9%
jan 1, 2009
121.626
+1.06
0.88%
jan 1, 2010
121.773
+0.147
0.12%
jan 1, 2011
123.132
+1.358
1.12%
jan 1, 2012
129.081
+5.95
4.83%
jan 1, 2013
130.176
+1.094
0.85%
jan 1, 2014
132.121
+1.945
1.49%
jan 1, 2015
132.317
+0.196
0.15%
Ranking of countries by current statistics by years


Comments: