29
/
en
AIzaSyAYiBZKx7MnpbEhh9jyipgxe19OcubqV5w
April 1, 2024
126235
El Salvador
SLV
true
2
1
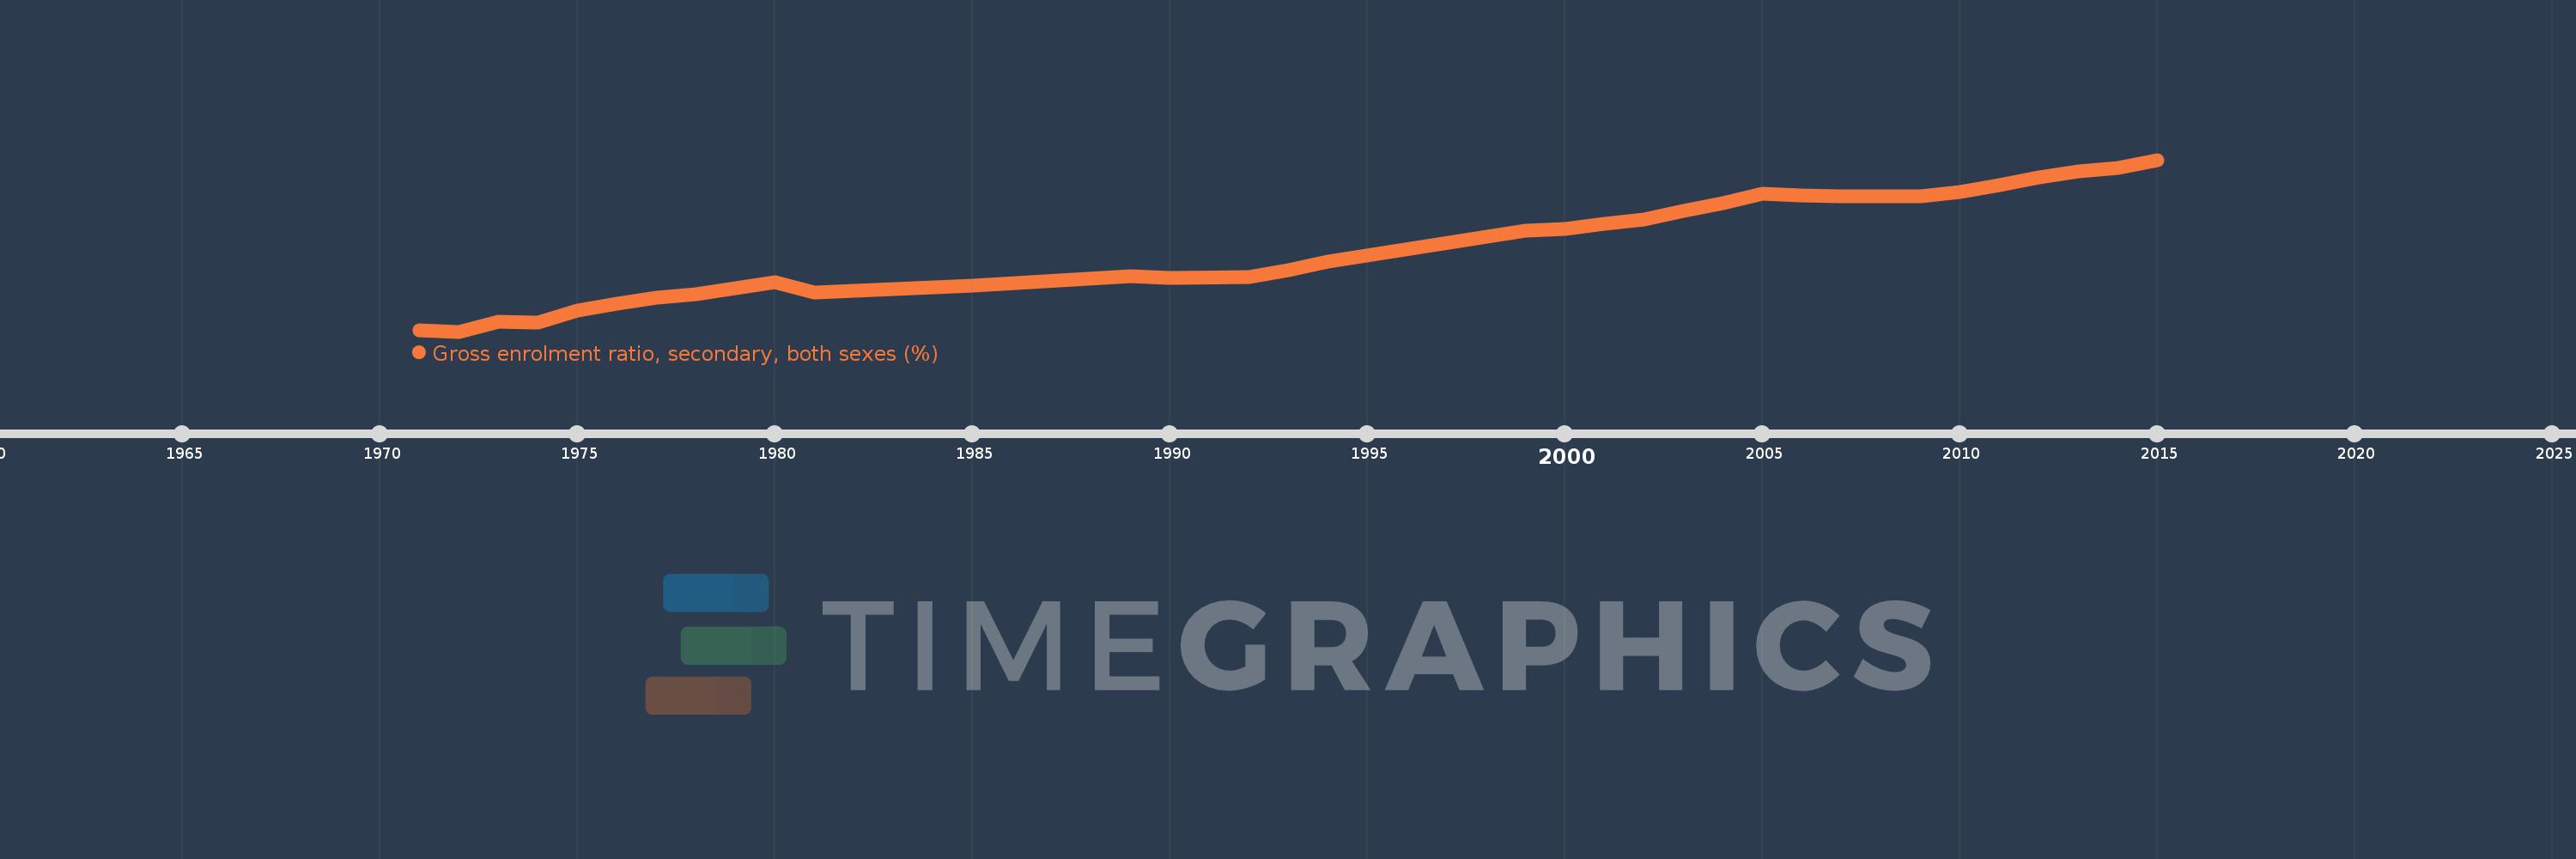
Gross enrolment ratio, secondary, both sexes (%)
2015,2014,2013,2012,2011,2010,2009,2008,2007,2006,2005,2004,2003,2002,2001,2000,1999,1994,1993,1992,1990,1989,1985,1984,1981,1980,1979,1978,1977,1976,1975,1974,1973,1972,1971
This statistics in other country:
AfghanistanAlbaniaAlgeriaAndorraAngolaAntigua and BarbudaArab WorldArgentinaArmeniaArubaAustraliaAustriaAzerbaijanBahamas, TheBahrainBangladeshBarbadosBelarusBelgiumBelizeBeninBermudaBhutanBoliviaBosnia and HerzegovinaBotswanaBrazilBritish Virgin IslandsBrunei DarussalamBulgariaBurkina FasoBurundiCabo VerdeCambodiaCameroonCanadaCaribbean small statesCentral African RepublicCentral Europe and the BalticsChadChileChinaColombiaComorosCongo, Dem. Rep.Congo, Rep.Costa RicaCote d'IvoireCroatiaCubaCuracaoCyprusCzech RepublicDenmarkDjiboutiDominicaDominican RepublicEarly-demographic dividendEast Asia & PacificEast Asia & Pacific (excluding high income)East Asia & Pacific (IDA & IBRD countries)EcuadorEgypt, Arab Rep.El SalvadorEquatorial GuineaEritreaEstoniaEthiopiaEuro areaEurope & Central AsiaEurope & Central Asia (excluding high income)Europe & Central Asia (IDA & IBRD countries)European UnionFijiFinlandFragile and conflict affected situationsFranceGabonGambia, TheGeorgiaGermanyGhanaGreeceGrenadaGuatemalaGuineaGuinea-BissauGuyanaHaitiHeavily indebted poor countries (HIPC)High incomeHondurasHong Kong SAR, ChinaHungaryIBRD onlyIcelandIDA & IBRD totalIDA blendIDA onlyIDA totalIndiaIndonesiaIran, Islamic Rep.IraqIrelandIsraelItalyJamaicaJapanJordanKazakhstanKenyaKiribatiKorea, Dem. People’s Rep.Korea, Rep.KuwaitKyrgyz RepublicLao PDRLate-demographic dividendLatin America & Caribbean Latin America & Caribbean (excluding high income)Latin America & the Caribbean (IDA & IBRD countries)LatviaLeast developed countries: UN classificationLebanonLesothoLiberiaLibyaLiechtensteinLithuaniaLow & middle incomeLow incomeLower middle incomeLuxembourgMacao SAR, ChinaMacedonia, FYRMadagascarMalawiMalaysiaMaldivesMaliMaltaMarshall IslandsMauritaniaMauritiusMexicoMicronesia, Fed. Sts.Middle East & North AfricaMiddle East & North Africa (excluding high income)Middle East & North Africa (IDA & IBRD countries)Middle incomeMoldovaMongoliaMontenegroMoroccoMozambiqueMyanmarNamibiaNauruNepalNetherlandsNew ZealandNicaraguaNigerNigeriaNorth AmericaNorwayOECD membersOmanOther small statesPacific island small statesPakistanPalauPanamaPapua New GuineaParaguayPeruPhilippinesPolandPortugalPost-demographic dividendPre-demographic dividendPuerto RicoQatarRomaniaRussian FederationRwandaSamoaSan MarinoSao Tome and PrincipeSaudi ArabiaSenegalSerbiaSeychellesSierra LeoneSlovak RepublicSloveniaSmall statesSolomon IslandsSomaliaSouth AfricaSouth AsiaSouth Asia (IDA & IBRD)SpainSri LankaSt. Kitts and NevisSt. LuciaSt. Vincent and the GrenadinesSub-Saharan Africa Sub-Saharan Africa (excluding high income)Sub-Saharan Africa (IDA & IBRD countries)SudanSurinameSwazilandSwedenSwitzerlandSyrian Arab RepublicTajikistanTanzaniaThailandTimor-LesteTogoTongaTrinidad and TobagoTunisiaTurkeyTurkmenistanTuvaluUgandaUkraineUnited Arab EmiratesUnited KingdomUnited StatesUpper middle incomeUruguayUzbekistanVanuatuVenezuela, RBVietnamWest Bank and GazaWorldYemen, Rep.ZambiaZimbabwe Timeline:
This timeline shows a graph from 1971 to 2015 of El Salvador. No data until 1970. Number of actual observations by date: 35.
Source name:
World Development Indicators
Source organization:
UNESCO Institute for Statistics
Categories, topics:
Education
Last updated:
apr 23, 2017
Indicators value changes by year
Minimum:
20.482
jan 1, 1972
Maximum:
81.116
jan 1, 2015
At the date of observation
Value
Absolute change
Change from previous value
jan 1, 1971
20.928
+20.928
0.0%
jan 1, 1972
20.482
-0.446
-2.13%
jan 1, 1973
24.007
+3.525
17.21%
jan 1, 1974
23.77
-0.237
-0.99%
jan 1, 1975
28.032
+4.262
17.93%
jan 1, 1976
30.199
+2.168
7.73%
jan 1, 1977
32.573
+2.374
7.86%
jan 1, 1978
33.672
+1.099
3.37%
jan 1, 1979
35.677
+2.005
5.95%
jan 1, 1980
37.78
+2.104
5.9%
jan 1, 1981
34.157
-3.623
-9.59%
jan 1, 1984
36.242
+2.085
6.1%
jan 1, 1985
36.598
+0.356
0.98%
jan 1, 1989
40.0
+3.402
9.3%
jan 1, 1990
39.522
-0.478
-1.19%
jan 1, 1992
39.745
+0.223
0.56%
jan 1, 1993
42.21
+2.465
6.2%
jan 1, 1994
45.091
+2.881
6.83%
jan 1, 1999
56.038
+10.946
24.28%
jan 1, 2000
56.609
+0.571
1.02%
jan 1, 2001
58.496
+1.887
3.33%
jan 1, 2002
60.135
+1.639
2.8%
jan 1, 2003
63.061
+2.926
4.87%
jan 1, 2004
65.957
+2.896
4.59%
jan 1, 2005
69.218
+3.262
4.95%
jan 1, 2006
68.534
-0.685
-0.99%
jan 1, 2007
68.244
-0.29
-0.42%
jan 1, 2008
68.351
+0.107
0.16%
jan 1, 2009
68.161
-0.19
-0.28%
jan 1, 2010
69.75
+1.589
2.33%
jan 1, 2011
72.021
+2.271
3.26%
jan 1, 2012
74.835
+2.814
3.91%
jan 1, 2013
77.145
+2.31
3.09%
jan 1, 2014
78.108
+0.963
1.25%
jan 1, 2015
81.116
+3.008
3.85%
Ranking of countries by current statistics by years


Comments: