29
/
en
AIzaSyAYiBZKx7MnpbEhh9jyipgxe19OcubqV5w
April 1, 2024
265816
Tonga
TON
true
2
1
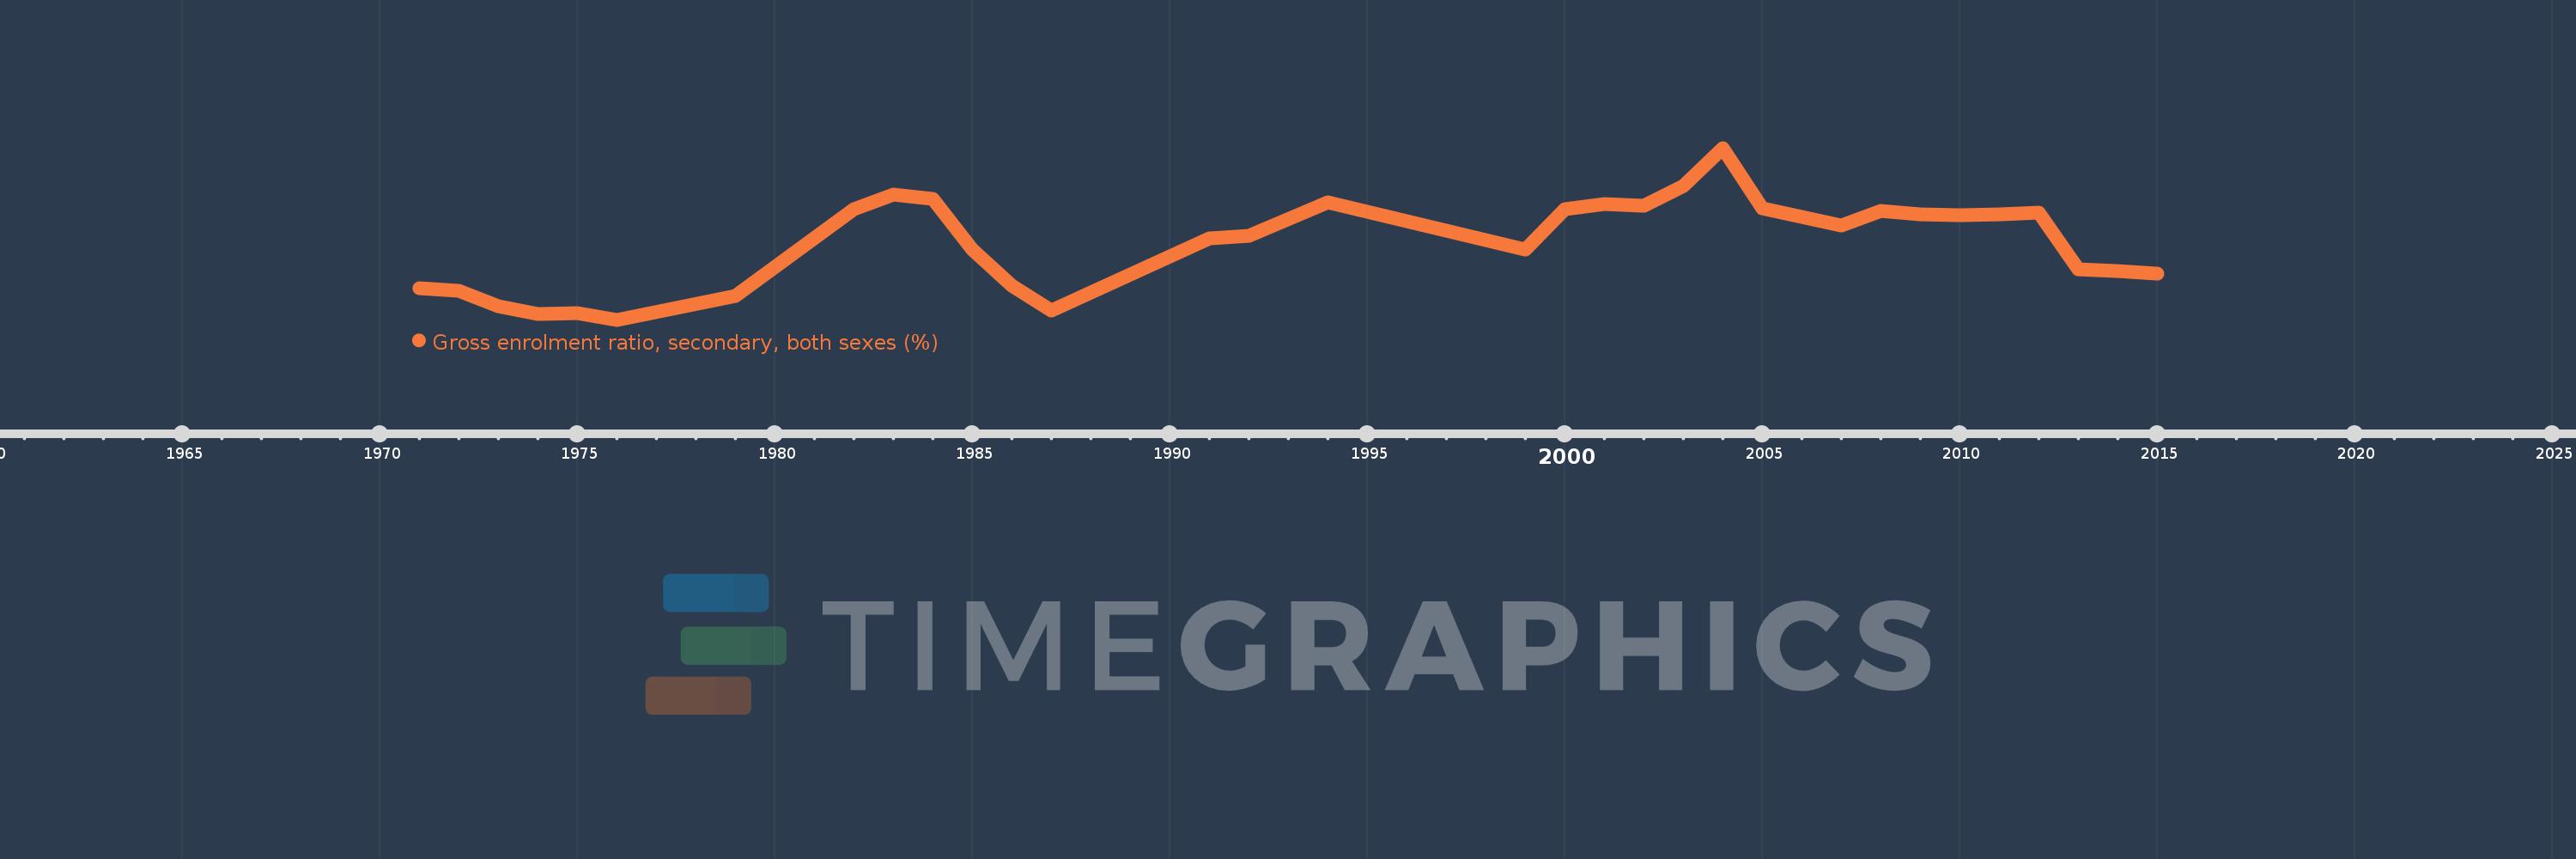
Gross enrolment ratio, secondary, both sexes (%)
2015,2014,2013,2012,2011,2010,2009,2008,2007,2005,2004,2003,2002,2001,2000,1999,1994,1992,1991,1987,1986,1985,1984,1983,1982,1979,1976,1975,1974,1973,1972,1971
This statistics in other country:
AfghanistanAlbaniaAlgeriaAndorraAngolaAntigua and BarbudaArab WorldArgentinaArmeniaArubaAustraliaAustriaAzerbaijanBahamas, TheBahrainBangladeshBarbadosBelarusBelgiumBelizeBeninBermudaBhutanBoliviaBosnia and HerzegovinaBotswanaBrazilBritish Virgin IslandsBrunei DarussalamBulgariaBurkina FasoBurundiCabo VerdeCambodiaCameroonCanadaCaribbean small statesCentral African RepublicCentral Europe and the BalticsChadChileChinaColombiaComorosCongo, Dem. Rep.Congo, Rep.Costa RicaCote d'IvoireCroatiaCubaCuracaoCyprusCzech RepublicDenmarkDjiboutiDominicaDominican RepublicEarly-demographic dividendEast Asia & PacificEast Asia & Pacific (excluding high income)East Asia & Pacific (IDA & IBRD countries)EcuadorEgypt, Arab Rep.El SalvadorEquatorial GuineaEritreaEstoniaEthiopiaEuro areaEurope & Central AsiaEurope & Central Asia (excluding high income)Europe & Central Asia (IDA & IBRD countries)European UnionFijiFinlandFragile and conflict affected situationsFranceGabonGambia, TheGeorgiaGermanyGhanaGreeceGrenadaGuatemalaGuineaGuinea-BissauGuyanaHaitiHeavily indebted poor countries (HIPC)High incomeHondurasHong Kong SAR, ChinaHungaryIBRD onlyIcelandIDA & IBRD totalIDA blendIDA onlyIDA totalIndiaIndonesiaIran, Islamic Rep.IraqIrelandIsraelItalyJamaicaJapanJordanKazakhstanKenyaKiribatiKorea, Dem. People’s Rep.Korea, Rep.KuwaitKyrgyz RepublicLao PDRLate-demographic dividendLatin America & Caribbean Latin America & Caribbean (excluding high income)Latin America & the Caribbean (IDA & IBRD countries)LatviaLeast developed countries: UN classificationLebanonLesothoLiberiaLibyaLiechtensteinLithuaniaLow & middle incomeLow incomeLower middle incomeLuxembourgMacao SAR, ChinaMacedonia, FYRMadagascarMalawiMalaysiaMaldivesMaliMaltaMarshall IslandsMauritaniaMauritiusMexicoMicronesia, Fed. Sts.Middle East & North AfricaMiddle East & North Africa (excluding high income)Middle East & North Africa (IDA & IBRD countries)Middle incomeMoldovaMongoliaMontenegroMoroccoMozambiqueMyanmarNamibiaNauruNepalNetherlandsNew ZealandNicaraguaNigerNigeriaNorth AmericaNorwayOECD membersOmanOther small statesPacific island small statesPakistanPalauPanamaPapua New GuineaParaguayPeruPhilippinesPolandPortugalPost-demographic dividendPre-demographic dividendPuerto RicoQatarRomaniaRussian FederationRwandaSamoaSan MarinoSao Tome and PrincipeSaudi ArabiaSenegalSerbiaSeychellesSierra LeoneSlovak RepublicSloveniaSmall statesSolomon IslandsSomaliaSouth AfricaSouth AsiaSouth Asia (IDA & IBRD)SpainSri LankaSt. Kitts and NevisSt. LuciaSt. Vincent and the GrenadinesSub-Saharan Africa Sub-Saharan Africa (excluding high income)Sub-Saharan Africa (IDA & IBRD countries)SudanSurinameSwazilandSwedenSwitzerlandSyrian Arab RepublicTajikistanTanzaniaThailandTimor-LesteTogoTongaTrinidad and TobagoTunisiaTurkeyTurkmenistanTuvaluUgandaUkraineUnited Arab EmiratesUnited KingdomUnited StatesUpper middle incomeUruguayUzbekistanVanuatuVenezuela, RBVietnamWest Bank and GazaWorldYemen, Rep.ZambiaZimbabwe Timeline:
This timeline shows a graph from 1971 to 2015 of Tonga. No data until 1970. Number of actual observations by date: 32.
Source name:
World Development Indicators
Source organization:
UNESCO Institute for Statistics
Categories, topics:
Education
Last updated:
apr 23, 2017
Indicators value changes by year
Minimum:
79.129
jan 1, 1976
Maximum:
119.928
jan 1, 2004
At the date of observation
Value
Absolute change
Change from previous value
jan 1, 1971
86.577
+86.577
0.0%
jan 1, 1972
86.071
-0.507
-0.59%
jan 1, 1973
82.283
-3.787
-4.4%
jan 1, 1974
80.494
-1.789
-2.17%
jan 1, 1975
80.719
+0.224
0.28%
jan 1, 1976
79.129
-1.59
-1.97%
jan 1, 1979
84.78
+5.651
7.14%
jan 1, 1982
105.368
+20.588
24.28%
jan 1, 1983
108.794
+3.426
3.25%
jan 1, 1984
107.875
-0.919
-0.84%
jan 1, 1985
95.831
-12.044
-11.16%
jan 1, 1986
87.294
-8.536
-8.91%
jan 1, 1987
81.252
-6.042
-6.92%
jan 1, 1991
98.432
+17.179
21.14%
jan 1, 1992
98.965
+0.534
0.54%
jan 1, 1994
106.945
+7.979
8.06%
jan 1, 1999
95.786
-11.159
-10.43%
jan 1, 2000
105.327
+9.541
9.96%
jan 1, 2001
106.512
+1.185
1.13%
jan 1, 2002
106.178
-0.334
-0.31%
jan 1, 2003
110.894
+4.716
4.44%
jan 1, 2004
119.928
+9.035
8.15%
jan 1, 2005
105.599
-14.329
-11.95%
jan 1, 2007
101.515
-4.084
-3.87%
jan 1, 2008
104.915
+3.4
3.35%
jan 1, 2009
104.231
-0.683
-0.65%
jan 1, 2010
103.871
-0.36
-0.35%
jan 1, 2011
104.159
+0.287
0.28%
jan 1, 2012
104.57
+0.411
0.39%
jan 1, 2013
91.141
-13.429
-12.84%
jan 1, 2014
90.643
-0.499
-0.55%
jan 1, 2015
90.099
-0.543
-0.6%
Ranking of countries by current statistics by years


Comments: