29
/
en
AIzaSyAYiBZKx7MnpbEhh9jyipgxe19OcubqV5w
April 1, 2024
55563
Pre-demographic dividend
PRE
false
2
1
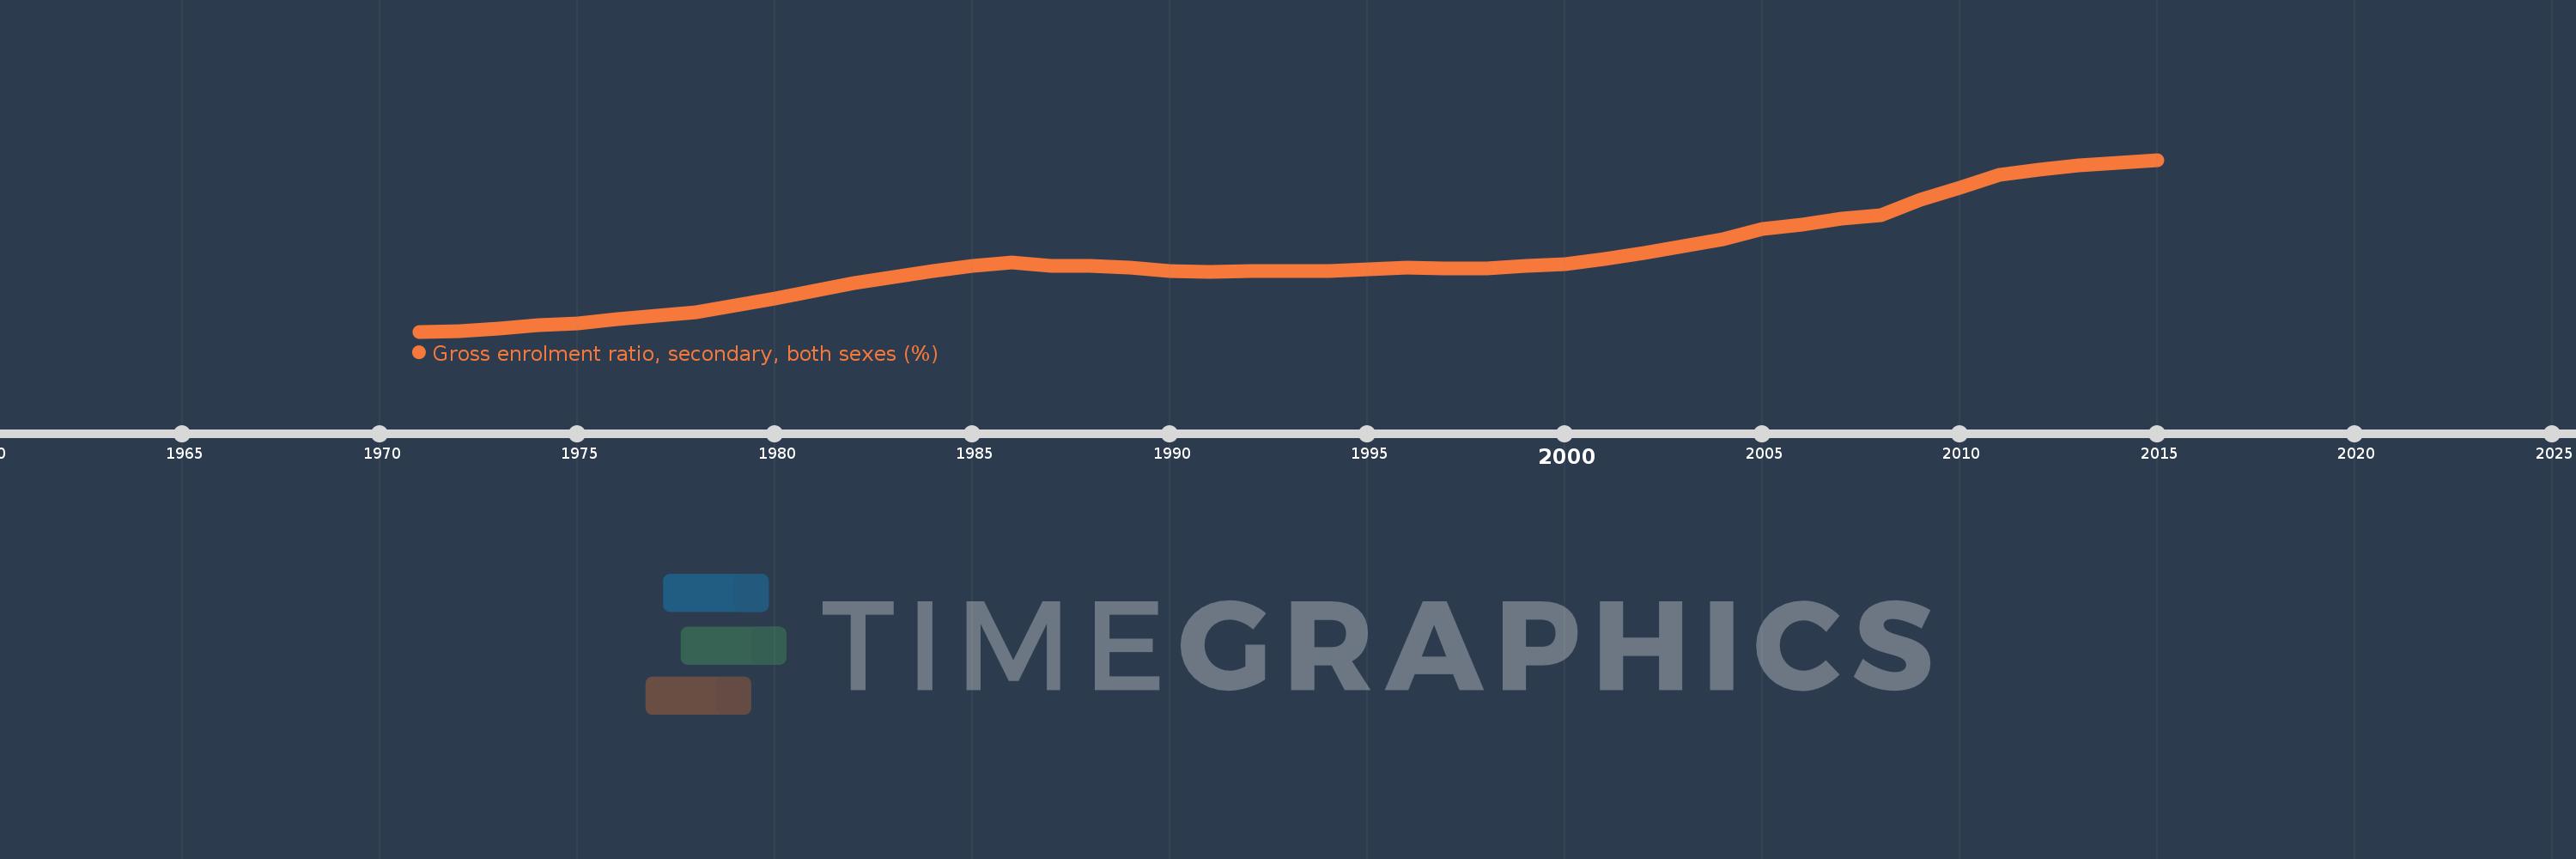
Gross enrolment ratio, secondary, both sexes (%)
2015,2014,2013,2012,2011,2010,2009,2008,2007,2006,2005,2004,2003,2002,2001,2000,1999,1998,1997,1996,1995,1994,1993,1992,1991,1990,1989,1988,1987,1986,1985,1984,1983,1982,1981,1980,1979,1978,1977,1976,1975,1974,1973,1972,1971
This statistics in other country:
AfghanistanAlbaniaAlgeriaAndorraAngolaAntigua and BarbudaArab WorldArgentinaArmeniaArubaAustraliaAustriaAzerbaijanBahamas, TheBahrainBangladeshBarbadosBelarusBelgiumBelizeBeninBermudaBhutanBoliviaBosnia and HerzegovinaBotswanaBrazilBritish Virgin IslandsBrunei DarussalamBulgariaBurkina FasoBurundiCabo VerdeCambodiaCameroonCanadaCaribbean small statesCentral African RepublicCentral Europe and the BalticsChadChileChinaColombiaComorosCongo, Dem. Rep.Congo, Rep.Costa RicaCote d'IvoireCroatiaCubaCuracaoCyprusCzech RepublicDenmarkDjiboutiDominicaDominican RepublicEarly-demographic dividendEast Asia & PacificEast Asia & Pacific (excluding high income)East Asia & Pacific (IDA & IBRD countries)EcuadorEgypt, Arab Rep.El SalvadorEquatorial GuineaEritreaEstoniaEthiopiaEuro areaEurope & Central AsiaEurope & Central Asia (excluding high income)Europe & Central Asia (IDA & IBRD countries)European UnionFijiFinlandFragile and conflict affected situationsFranceGabonGambia, TheGeorgiaGermanyGhanaGreeceGrenadaGuatemalaGuineaGuinea-BissauGuyanaHaitiHeavily indebted poor countries (HIPC)High incomeHondurasHong Kong SAR, ChinaHungaryIBRD onlyIcelandIDA & IBRD totalIDA blendIDA onlyIDA totalIndiaIndonesiaIran, Islamic Rep.IraqIrelandIsraelItalyJamaicaJapanJordanKazakhstanKenyaKiribatiKorea, Dem. People’s Rep.Korea, Rep.KuwaitKyrgyz RepublicLao PDRLate-demographic dividendLatin America & Caribbean Latin America & Caribbean (excluding high income)Latin America & the Caribbean (IDA & IBRD countries)LatviaLeast developed countries: UN classificationLebanonLesothoLiberiaLibyaLiechtensteinLithuaniaLow & middle incomeLow incomeLower middle incomeLuxembourgMacao SAR, ChinaMacedonia, FYRMadagascarMalawiMalaysiaMaldivesMaliMaltaMarshall IslandsMauritaniaMauritiusMexicoMicronesia, Fed. Sts.Middle East & North AfricaMiddle East & North Africa (excluding high income)Middle East & North Africa (IDA & IBRD countries)Middle incomeMoldovaMongoliaMontenegroMoroccoMozambiqueMyanmarNamibiaNauruNepalNetherlandsNew ZealandNicaraguaNigerNigeriaNorth AmericaNorwayOECD membersOmanOther small statesPacific island small statesPakistanPalauPanamaPapua New GuineaParaguayPeruPhilippinesPolandPortugalPost-demographic dividendPre-demographic dividendPuerto RicoQatarRomaniaRussian FederationRwandaSamoaSan MarinoSao Tome and PrincipeSaudi ArabiaSenegalSerbiaSeychellesSierra LeoneSlovak RepublicSloveniaSmall statesSolomon IslandsSomaliaSouth AfricaSouth AsiaSouth Asia (IDA & IBRD)SpainSri LankaSt. Kitts and NevisSt. LuciaSt. Vincent and the GrenadinesSub-Saharan Africa Sub-Saharan Africa (excluding high income)Sub-Saharan Africa (IDA & IBRD countries)SudanSurinameSwazilandSwedenSwitzerlandSyrian Arab RepublicTajikistanTanzaniaThailandTimor-LesteTogoTongaTrinidad and TobagoTunisiaTurkeyTurkmenistanTuvaluUgandaUkraineUnited Arab EmiratesUnited KingdomUnited StatesUpper middle incomeUruguayUzbekistanVanuatuVenezuela, RBVietnamWest Bank and GazaWorldYemen, Rep.ZambiaZimbabwe Timeline:
This timeline shows a graph from 1971 to 2015 of Pre-demographic dividend. No data until 1970. Number of actual observations by date: 45.
Source name:
World Development Indicators
Source organization:
UNESCO Institute for Statistics
Categories, topics:
Education
Last updated:
apr 23, 2017
Indicators value changes by year
Maximum:
41.102
jan 1, 2015
At the date of observation
Value
Absolute change
Change from previous value
jan 1, 1971
9.809
+9.809
0.0%
jan 1, 1972
9.924
+0.115
1.17%
jan 1, 1973
10.418
+0.494
4.98%
jan 1, 1974
10.921
+0.503
4.83%
jan 1, 1975
11.3
+0.379
3.47%
jan 1, 1976
12.063
+0.763
6.75%
jan 1, 1977
12.71
+0.647
5.36%
jan 1, 1978
13.402
+0.692
5.44%
jan 1, 1979
14.542
+1.14
8.51%
jan 1, 1980
15.824
+1.282
8.82%
jan 1, 1981
17.261
+1.437
9.08%
jan 1, 1982
18.603
+1.342
7.78%
jan 1, 1983
19.779
+1.176
6.32%
jan 1, 1984
20.837
+1.058
5.35%
jan 1, 1985
21.841
+1.003
4.81%
jan 1, 1986
22.407
+0.566
2.59%
jan 1, 1987
21.759
-0.648
-2.89%
jan 1, 1988
21.765
+0.007
0.03%
jan 1, 1989
21.427
-0.338
-1.55%
jan 1, 1990
20.788
-0.639
-2.98%
jan 1, 1991
20.718
-0.07
-0.34%
jan 1, 1992
20.807
+0.089
0.43%
jan 1, 1993
20.802
-0.006
-0.03%
jan 1, 1994
20.838
+0.036
0.18%
jan 1, 1995
21.101
+0.263
1.26%
jan 1, 1996
21.435
+0.334
1.58%
jan 1, 1997
21.377
-0.057
-0.27%
jan 1, 1998
21.385
+0.008
0.04%
jan 1, 1999
21.788
+0.403
1.88%
jan 1, 2000
22.16
+0.372
1.71%
jan 1, 2001
23.013
+0.853
3.85%
jan 1, 2002
24.182
+1.169
5.08%
jan 1, 2003
25.332
+1.15
4.76%
jan 1, 2004
26.688
+1.356
5.35%
jan 1, 2005
28.44
+1.752
6.56%
jan 1, 2006
29.257
+0.817
2.87%
jan 1, 2007
30.307
+1.049
3.59%
jan 1, 2008
31.043
+0.736
2.43%
jan 1, 2009
33.786
+2.743
8.84%
jan 1, 2010
36.075
+2.289
6.78%
jan 1, 2011
38.354
+2.279
6.32%
jan 1, 2012
39.273
+0.918
2.39%
jan 1, 2013
40.154
+0.881
2.24%
jan 1, 2014
40.487
+0.333
0.83%
jan 1, 2015
41.102
+0.616
1.52%
Ranking of countries by current statistics by years


Comments: