29
/
en
AIzaSyAYiBZKx7MnpbEhh9jyipgxe19OcubqV5w
April 1, 2024
119924
Djibouti
DJI
true
2
1
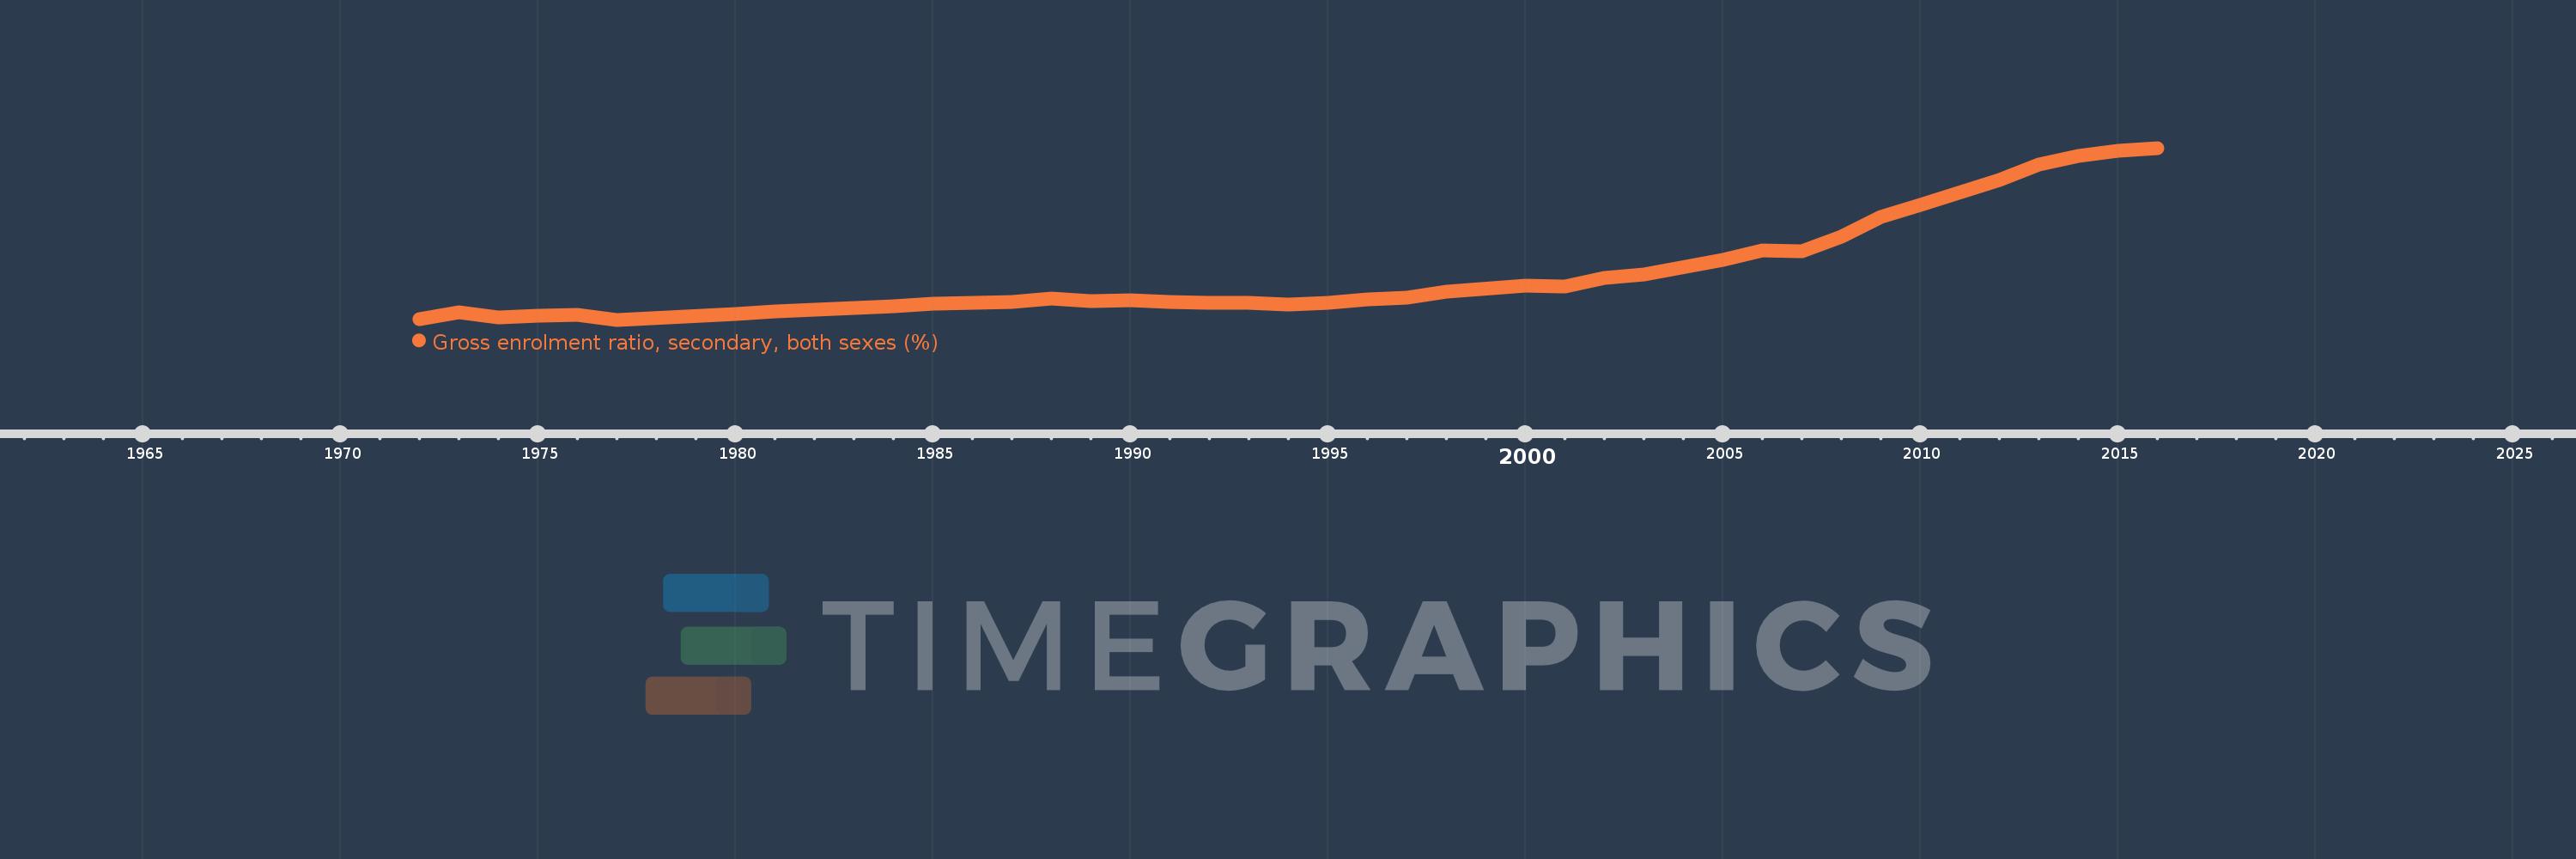
Gross enrolment ratio, secondary, both sexes (%)
2016,2015,2014,2013,2012,2010,2009,2008,2007,2006,2005,2003,2002,2001,2000,1998,1997,1996,1995,1994,1993,1992,1991,1990,1989,1988,1987,1986,1985,1984,1983,1982,1981,1980,1977,1976,1975,1974,1973,1972
This statistics in other country:
AfghanistanAlbaniaAlgeriaAndorraAngolaAntigua and BarbudaArab WorldArgentinaArmeniaArubaAustraliaAustriaAzerbaijanBahamas, TheBahrainBangladeshBarbadosBelarusBelgiumBelizeBeninBermudaBhutanBoliviaBosnia and HerzegovinaBotswanaBrazilBritish Virgin IslandsBrunei DarussalamBulgariaBurkina FasoBurundiCabo VerdeCambodiaCameroonCanadaCaribbean small statesCentral African RepublicCentral Europe and the BalticsChadChileChinaColombiaComorosCongo, Dem. Rep.Congo, Rep.Costa RicaCote d'IvoireCroatiaCubaCuracaoCyprusCzech RepublicDenmarkDjiboutiDominicaDominican RepublicEarly-demographic dividendEast Asia & PacificEast Asia & Pacific (excluding high income)East Asia & Pacific (IDA & IBRD countries)EcuadorEgypt, Arab Rep.El SalvadorEquatorial GuineaEritreaEstoniaEthiopiaEuro areaEurope & Central AsiaEurope & Central Asia (excluding high income)Europe & Central Asia (IDA & IBRD countries)European UnionFijiFinlandFragile and conflict affected situationsFranceGabonGambia, TheGeorgiaGermanyGhanaGreeceGrenadaGuatemalaGuineaGuinea-BissauGuyanaHaitiHeavily indebted poor countries (HIPC)High incomeHondurasHong Kong SAR, ChinaHungaryIBRD onlyIcelandIDA & IBRD totalIDA blendIDA onlyIDA totalIndiaIndonesiaIran, Islamic Rep.IraqIrelandIsraelItalyJamaicaJapanJordanKazakhstanKenyaKiribatiKorea, Dem. People’s Rep.Korea, Rep.KuwaitKyrgyz RepublicLao PDRLate-demographic dividendLatin America & Caribbean Latin America & Caribbean (excluding high income)Latin America & the Caribbean (IDA & IBRD countries)LatviaLeast developed countries: UN classificationLebanonLesothoLiberiaLibyaLiechtensteinLithuaniaLow & middle incomeLow incomeLower middle incomeLuxembourgMacao SAR, ChinaMacedonia, FYRMadagascarMalawiMalaysiaMaldivesMaliMaltaMarshall IslandsMauritaniaMauritiusMexicoMicronesia, Fed. Sts.Middle East & North AfricaMiddle East & North Africa (excluding high income)Middle East & North Africa (IDA & IBRD countries)Middle incomeMoldovaMongoliaMontenegroMoroccoMozambiqueMyanmarNamibiaNauruNepalNetherlandsNew ZealandNicaraguaNigerNigeriaNorth AmericaNorwayOECD membersOmanOther small statesPacific island small statesPakistanPalauPanamaPapua New GuineaParaguayPeruPhilippinesPolandPortugalPost-demographic dividendPre-demographic dividendPuerto RicoQatarRomaniaRussian FederationRwandaSamoaSan MarinoSao Tome and PrincipeSaudi ArabiaSenegalSerbiaSeychellesSierra LeoneSlovak RepublicSloveniaSmall statesSolomon IslandsSomaliaSouth AfricaSouth AsiaSouth Asia (IDA & IBRD)SpainSri LankaSt. Kitts and NevisSt. LuciaSt. Vincent and the GrenadinesSub-Saharan Africa Sub-Saharan Africa (excluding high income)Sub-Saharan Africa (IDA & IBRD countries)SudanSurinameSwazilandSwedenSwitzerlandSyrian Arab RepublicTajikistanTanzaniaThailandTimor-LesteTogoTongaTrinidad and TobagoTunisiaTurkeyTurkmenistanTuvaluUgandaUkraineUnited Arab EmiratesUnited KingdomUnited StatesUpper middle incomeUruguayUzbekistanVanuatuVenezuela, RBVietnamWest Bank and GazaWorldYemen, Rep.ZambiaZimbabwe Timeline:
This timeline shows a graph from 1972 to 2016 of Djibouti. No data until 1971. Number of actual observations by date: 40.
Source name:
World Development Indicators
Source organization:
UNESCO Institute for Statistics
Categories, topics:
Education
Last updated:
apr 23, 2017
Indicators value changes by year
Maximum:
47.069
jan 1, 2016
At the date of observation
Value
Absolute change
Change from previous value
jan 1, 1972
6.197
+6.197
0.0%
jan 1, 1973
7.726
+1.528
24.66%
jan 1, 1974
6.562
-1.164
-15.06%
jan 1, 1975
6.98
+0.418
6.38%
jan 1, 1976
7.192
+0.212
3.04%
jan 1, 1977
6.02
-1.173
-16.3%
jan 1, 1980
7.456
+1.436
23.85%
jan 1, 1981
7.944
+0.488
6.55%
jan 1, 1982
8.42
+0.476
6.0%
jan 1, 1983
8.832
+0.412
4.89%
jan 1, 1984
9.296
+0.464
5.26%
jan 1, 1985
9.78
+0.484
5.2%
jan 1, 1986
10.011
+0.231
2.36%
jan 1, 1987
10.315
+0.304
3.04%
jan 1, 1988
11.045
+0.731
7.08%
jan 1, 1989
10.481
-0.564
-5.11%
jan 1, 1990
10.681
+0.199
1.9%
jan 1, 1991
10.248
-0.433
-4.05%
jan 1, 1992
10.007
-0.241
-2.35%
jan 1, 1993
10.159
+0.152
1.52%
jan 1, 1994
9.606
-0.553
-5.44%
jan 1, 1995
10.062
+0.456
4.75%
jan 1, 1996
10.946
+0.884
8.79%
jan 1, 1997
11.387
+0.441
4.03%
jan 1, 1998
12.69
+1.303
11.44%
jan 1, 2000
14.267
+1.576
12.42%
jan 1, 2001
14.057
-0.209
-1.47%
jan 1, 2002
16.03
+1.973
14.03%
jan 1, 2003
16.756
+0.726
4.53%
jan 1, 2005
20.224
+3.468
20.7%
jan 1, 2006
22.482
+2.258
11.16%
jan 1, 2007
22.308
-0.175
-0.78%
jan 1, 2008
25.785
+3.478
15.59%
jan 1, 2009
30.645
+4.859
18.85%
jan 1, 2010
33.488
+2.843
9.28%
jan 1, 2012
39.369
+5.881
17.56%
jan 1, 2013
43.063
+3.695
9.38%
jan 1, 2014
45.058
+1.994
4.63%
jan 1, 2015
46.353
+1.295
2.87%
jan 1, 2016
47.069
+0.716
1.54%
Ranking of countries by current statistics by years


Comments: