29
/
en
AIzaSyAYiBZKx7MnpbEhh9jyipgxe19OcubqV5w
April 1, 2024
227470
Qatar
QAT
true
2
1
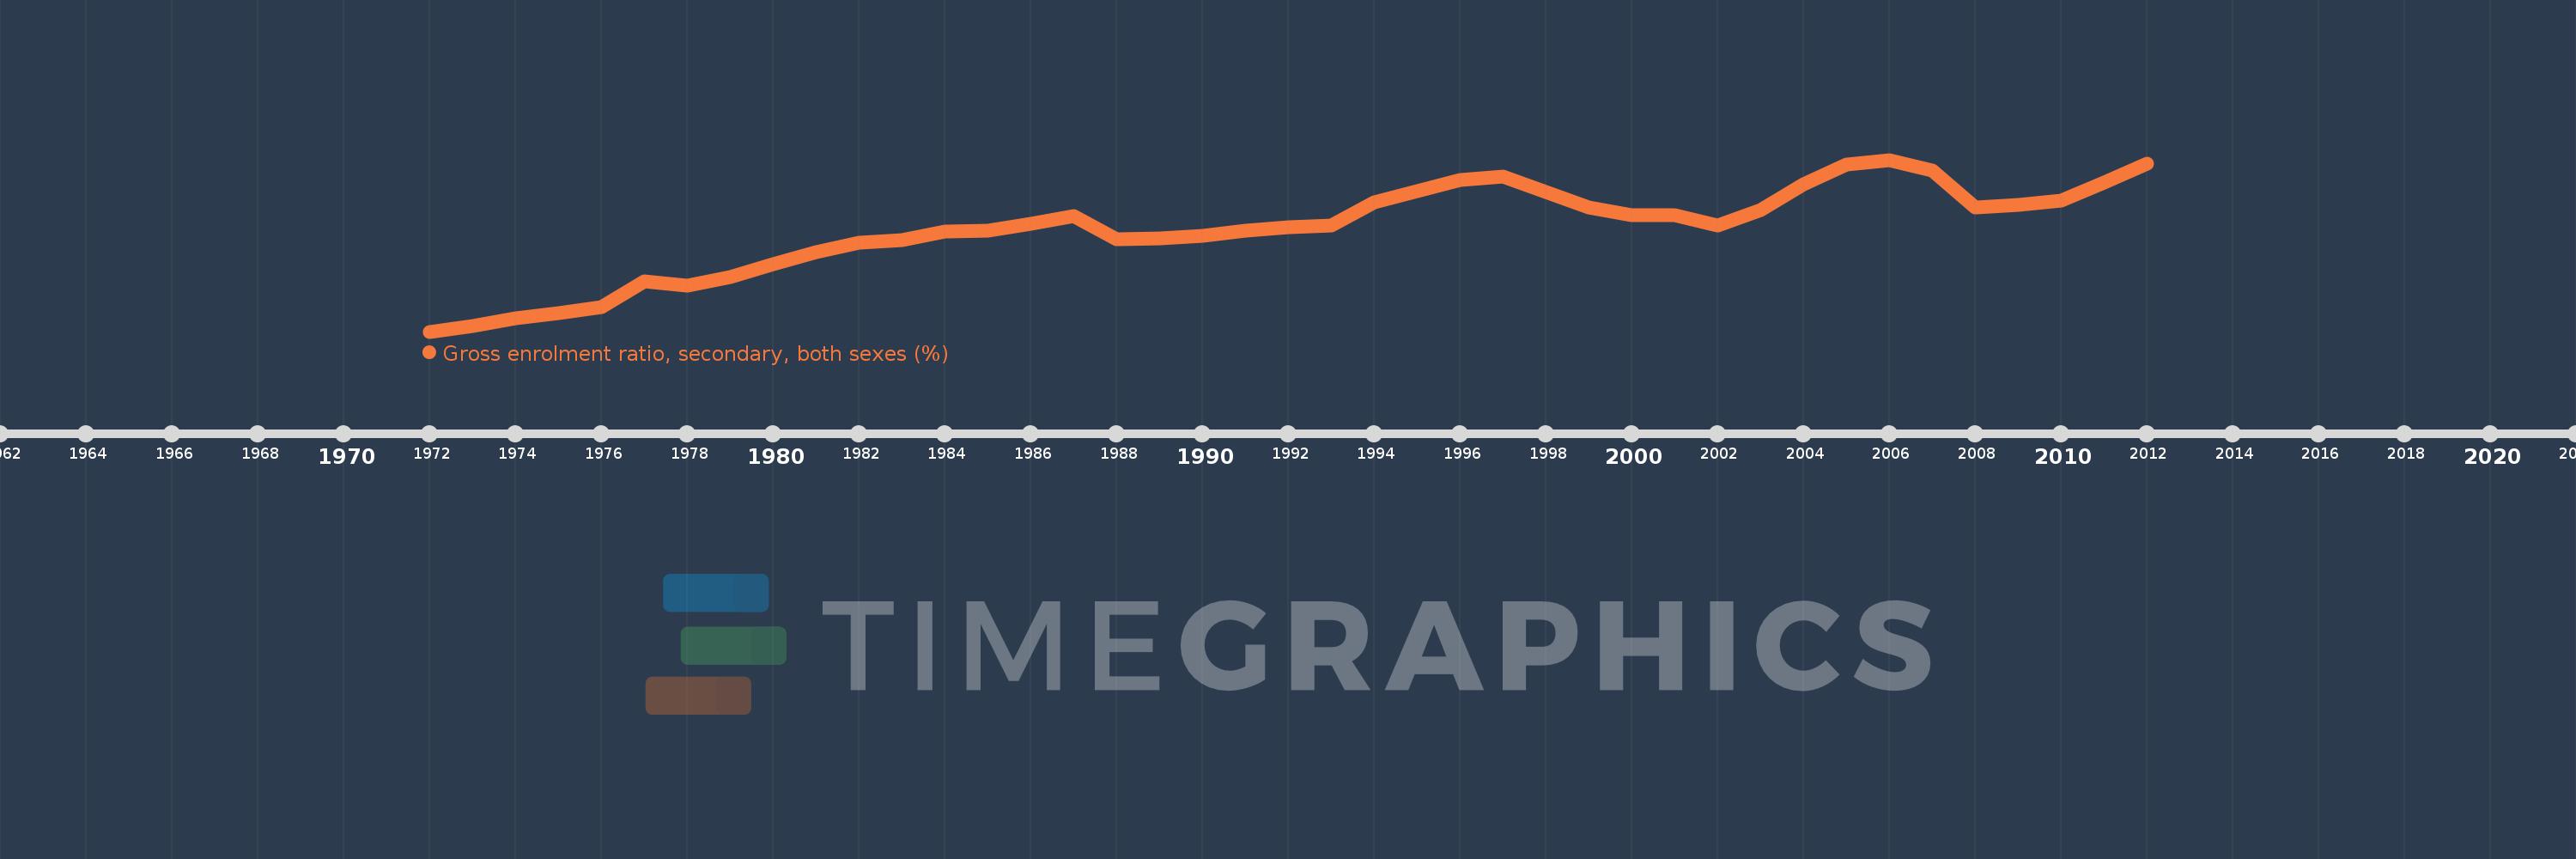
Gross enrolment ratio, secondary, both sexes (%)
2012,2011,2010,2009,2008,2007,2006,2005,2004,2003,2002,2001,2000,1999,1997,1996,1995,1994,1993,1992,1991,1990,1989,1988,1987,1986,1985,1984,1983,1982,1981,1980,1979,1978,1977,1976,1975,1974,1973,1972
This statistics in other country:
AfghanistanAlbaniaAlgeriaAndorraAngolaAntigua and BarbudaArab WorldArgentinaArmeniaArubaAustraliaAustriaAzerbaijanBahamas, TheBahrainBangladeshBarbadosBelarusBelgiumBelizeBeninBermudaBhutanBoliviaBosnia and HerzegovinaBotswanaBrazilBritish Virgin IslandsBrunei DarussalamBulgariaBurkina FasoBurundiCabo VerdeCambodiaCameroonCanadaCaribbean small statesCentral African RepublicCentral Europe and the BalticsChadChileChinaColombiaComorosCongo, Dem. Rep.Congo, Rep.Costa RicaCote d'IvoireCroatiaCubaCuracaoCyprusCzech RepublicDenmarkDjiboutiDominicaDominican RepublicEarly-demographic dividendEast Asia & PacificEast Asia & Pacific (excluding high income)East Asia & Pacific (IDA & IBRD countries)EcuadorEgypt, Arab Rep.El SalvadorEquatorial GuineaEritreaEstoniaEthiopiaEuro areaEurope & Central AsiaEurope & Central Asia (excluding high income)Europe & Central Asia (IDA & IBRD countries)European UnionFijiFinlandFragile and conflict affected situationsFranceGabonGambia, TheGeorgiaGermanyGhanaGreeceGrenadaGuatemalaGuineaGuinea-BissauGuyanaHaitiHeavily indebted poor countries (HIPC)High incomeHondurasHong Kong SAR, ChinaHungaryIBRD onlyIcelandIDA & IBRD totalIDA blendIDA onlyIDA totalIndiaIndonesiaIran, Islamic Rep.IraqIrelandIsraelItalyJamaicaJapanJordanKazakhstanKenyaKiribatiKorea, Dem. People’s Rep.Korea, Rep.KuwaitKyrgyz RepublicLao PDRLate-demographic dividendLatin America & Caribbean Latin America & Caribbean (excluding high income)Latin America & the Caribbean (IDA & IBRD countries)LatviaLeast developed countries: UN classificationLebanonLesothoLiberiaLibyaLiechtensteinLithuaniaLow & middle incomeLow incomeLower middle incomeLuxembourgMacao SAR, ChinaMacedonia, FYRMadagascarMalawiMalaysiaMaldivesMaliMaltaMarshall IslandsMauritaniaMauritiusMexicoMicronesia, Fed. Sts.Middle East & North AfricaMiddle East & North Africa (excluding high income)Middle East & North Africa (IDA & IBRD countries)Middle incomeMoldovaMongoliaMontenegroMoroccoMozambiqueMyanmarNamibiaNauruNepalNetherlandsNew ZealandNicaraguaNigerNigeriaNorth AmericaNorwayOECD membersOmanOther small statesPacific island small statesPakistanPalauPanamaPapua New GuineaParaguayPeruPhilippinesPolandPortugalPost-demographic dividendPre-demographic dividendPuerto RicoQatarRomaniaRussian FederationRwandaSamoaSan MarinoSao Tome and PrincipeSaudi ArabiaSenegalSerbiaSeychellesSierra LeoneSlovak RepublicSloveniaSmall statesSolomon IslandsSomaliaSouth AfricaSouth AsiaSouth Asia (IDA & IBRD)SpainSri LankaSt. Kitts and NevisSt. LuciaSt. Vincent and the GrenadinesSub-Saharan Africa Sub-Saharan Africa (excluding high income)Sub-Saharan Africa (IDA & IBRD countries)SudanSurinameSwazilandSwedenSwitzerlandSyrian Arab RepublicTajikistanTanzaniaThailandTimor-LesteTogoTongaTrinidad and TobagoTunisiaTurkeyTurkmenistanTuvaluUgandaUkraineUnited Arab EmiratesUnited KingdomUnited StatesUpper middle incomeUruguayUzbekistanVanuatuVenezuela, RBVietnamWest Bank and GazaWorldYemen, Rep.ZambiaZimbabwe Timeline:
This timeline shows a graph from 1972 to 2012 of Qatar. No data until 1971. Number of actual observations by date: 40.
Source name:
World Development Indicators
Source organization:
UNESCO Institute for Statistics
Categories, topics:
Education
Last updated:
apr 23, 2017
Indicators value changes by year
Minimum:
34.922
jan 1, 1972
Maximum:
111.148
jan 1, 2006
At the date of observation
Value
Absolute change
Change from previous value
jan 1, 1972
34.922
+34.922
0.0%
jan 1, 1973
37.401
+2.479
7.1%
jan 1, 1974
41.017
+3.615
9.67%
jan 1, 1975
43.014
+1.997
4.87%
jan 1, 1976
45.657
+2.643
6.15%
jan 1, 1977
57.402
+11.745
25.72%
jan 1, 1978
55.166
-2.235
-3.89%
jan 1, 1979
58.979
+3.812
6.91%
jan 1, 1980
64.808
+5.829
9.88%
jan 1, 1981
70.073
+5.265
8.12%
jan 1, 1982
74.328
+4.255
6.07%
jan 1, 1983
75.496
+1.168
1.57%
jan 1, 1984
79.29
+3.794
5.03%
jan 1, 1985
79.645
+0.354
0.45%
jan 1, 1986
82.787
+3.142
3.94%
jan 1, 1987
86.193
+3.406
4.11%
jan 1, 1988
75.973
-10.22
-11.86%
jan 1, 1989
76.354
+0.381
0.5%
jan 1, 1990
77.232
+0.878
1.15%
jan 1, 1991
79.72
+2.488
3.22%
jan 1, 1992
81.299
+1.578
1.98%
jan 1, 1993
81.893
+0.594
0.73%
jan 1, 1994
92.334
+10.441
12.75%
jan 1, 1995
97.405
+5.071
5.49%
jan 1, 1996
102.272
+4.867
5.0%
jan 1, 1997
103.753
+1.481
1.45%
jan 1, 1999
89.959
-13.794
-13.3%
jan 1, 2000
86.465
-3.494
-3.88%
jan 1, 2001
86.601
+0.136
0.16%
jan 1, 2002
82.047
-4.553
-5.26%
jan 1, 2003
88.923
+6.876
8.38%
jan 1, 2004
100.112
+11.189
12.58%
jan 1, 2005
109.022
+8.91
8.9%
jan 1, 2006
111.148
+2.125
1.95%
jan 1, 2007
106.302
-4.846
-4.36%
jan 1, 2008
90.129
-16.173
-15.21%
jan 1, 2009
91.084
+0.955
1.06%
jan 1, 2010
92.906
+1.822
2.0%
jan 1, 2011
101.059
+8.152
8.77%
jan 1, 2012
109.411
+8.352
8.26%
Ranking of countries by current statistics by years


Comments: