29
/
en
AIzaSyAYiBZKx7MnpbEhh9jyipgxe19OcubqV5w
April 1, 2024
89860
Botswana
BWA
true
2
1
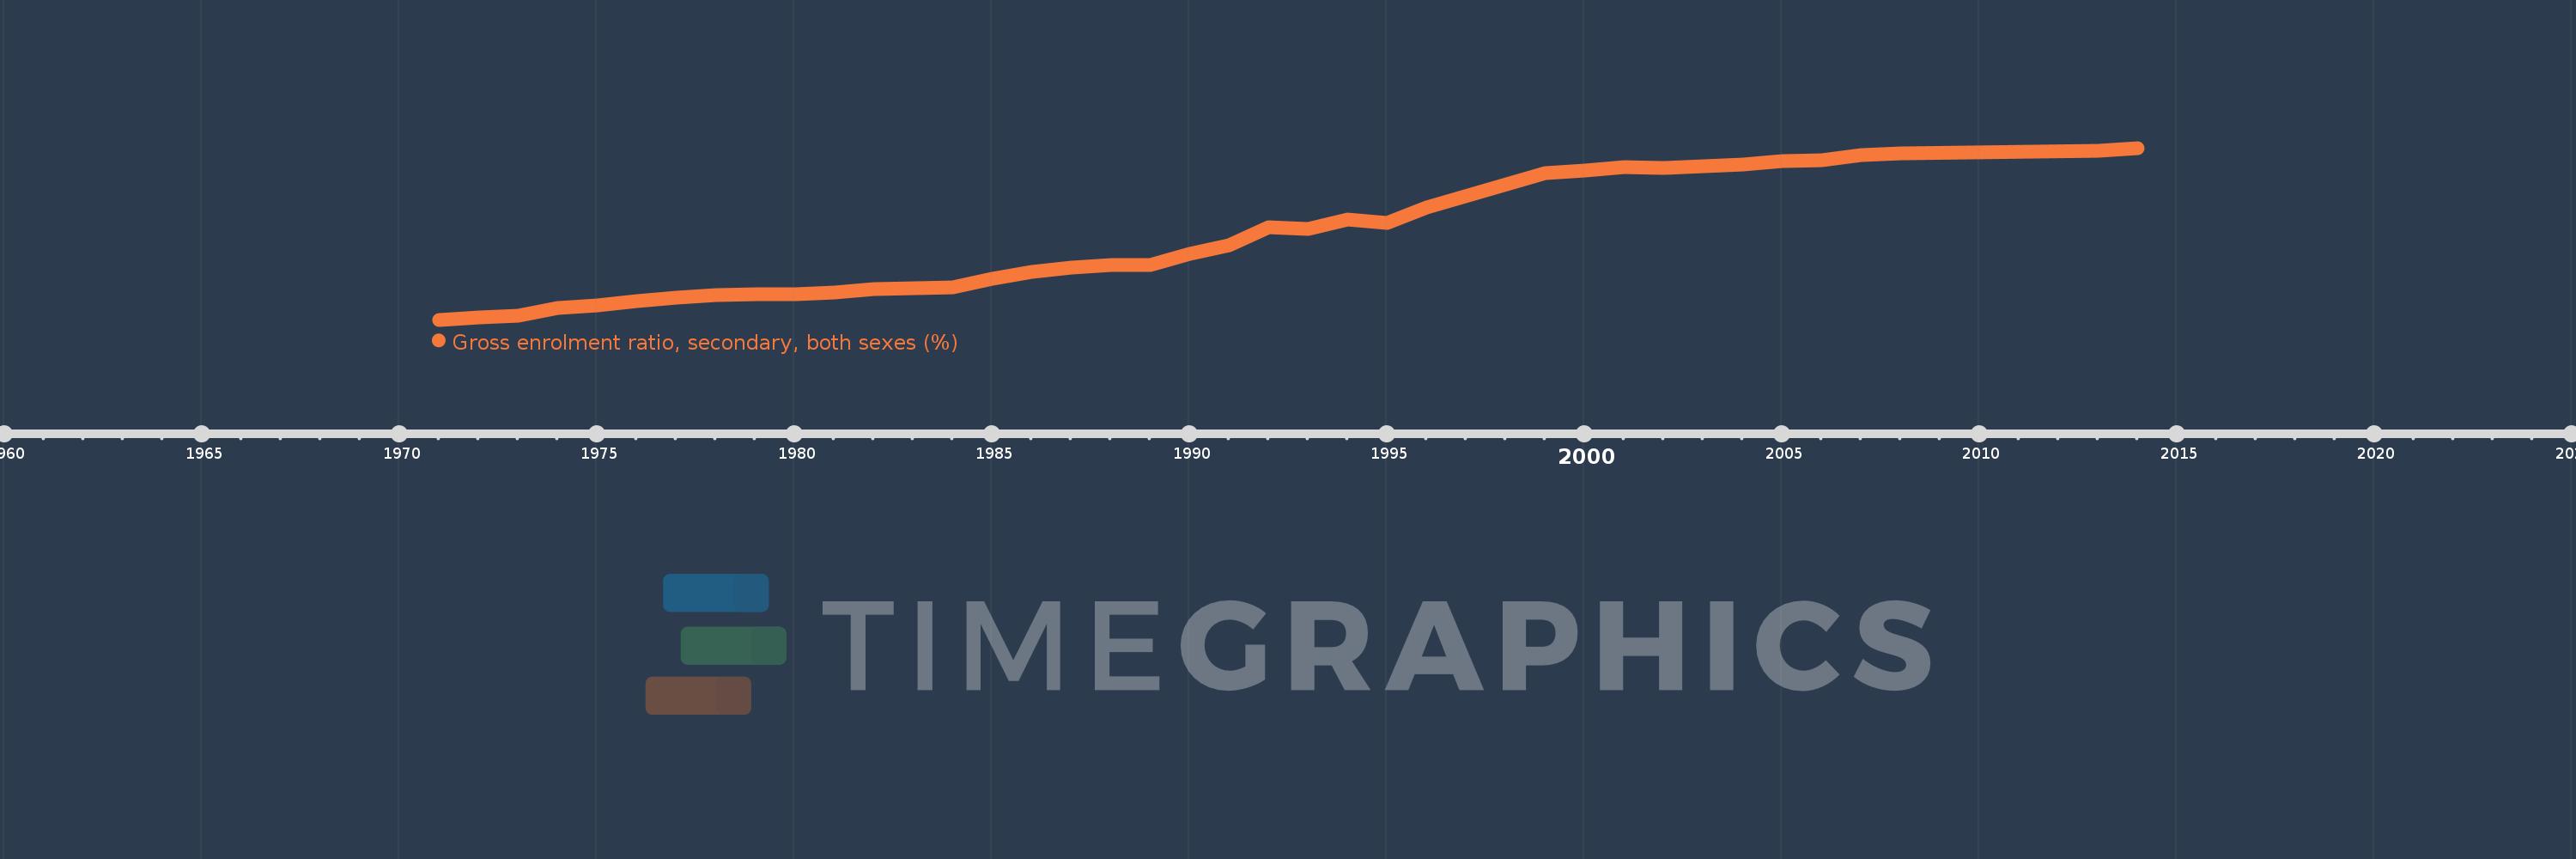
Gross enrolment ratio, secondary, both sexes (%)
2014,2013,2008,2007,2006,2005,2004,2003,2002,2001,2000,1999,1996,1995,1994,1993,1992,1991,1990,1989,1988,1987,1986,1985,1984,1982,1981,1980,1979,1978,1977,1976,1975,1974,1973,1972,1971
This statistics in other country:
AfghanistanAlbaniaAlgeriaAndorraAngolaAntigua and BarbudaArab WorldArgentinaArmeniaArubaAustraliaAustriaAzerbaijanBahamas, TheBahrainBangladeshBarbadosBelarusBelgiumBelizeBeninBermudaBhutanBoliviaBosnia and HerzegovinaBotswanaBrazilBritish Virgin IslandsBrunei DarussalamBulgariaBurkina FasoBurundiCabo VerdeCambodiaCameroonCanadaCaribbean small statesCentral African RepublicCentral Europe and the BalticsChadChileChinaColombiaComorosCongo, Dem. Rep.Congo, Rep.Costa RicaCote d'IvoireCroatiaCubaCuracaoCyprusCzech RepublicDenmarkDjiboutiDominicaDominican RepublicEarly-demographic dividendEast Asia & PacificEast Asia & Pacific (excluding high income)East Asia & Pacific (IDA & IBRD countries)EcuadorEgypt, Arab Rep.El SalvadorEquatorial GuineaEritreaEstoniaEthiopiaEuro areaEurope & Central AsiaEurope & Central Asia (excluding high income)Europe & Central Asia (IDA & IBRD countries)European UnionFijiFinlandFragile and conflict affected situationsFranceGabonGambia, TheGeorgiaGermanyGhanaGreeceGrenadaGuatemalaGuineaGuinea-BissauGuyanaHaitiHeavily indebted poor countries (HIPC)High incomeHondurasHong Kong SAR, ChinaHungaryIBRD onlyIcelandIDA & IBRD totalIDA blendIDA onlyIDA totalIndiaIndonesiaIran, Islamic Rep.IraqIrelandIsraelItalyJamaicaJapanJordanKazakhstanKenyaKiribatiKorea, Dem. People’s Rep.Korea, Rep.KuwaitKyrgyz RepublicLao PDRLate-demographic dividendLatin America & Caribbean Latin America & Caribbean (excluding high income)Latin America & the Caribbean (IDA & IBRD countries)LatviaLeast developed countries: UN classificationLebanonLesothoLiberiaLibyaLiechtensteinLithuaniaLow & middle incomeLow incomeLower middle incomeLuxembourgMacao SAR, ChinaMacedonia, FYRMadagascarMalawiMalaysiaMaldivesMaliMaltaMarshall IslandsMauritaniaMauritiusMexicoMicronesia, Fed. Sts.Middle East & North AfricaMiddle East & North Africa (excluding high income)Middle East & North Africa (IDA & IBRD countries)Middle incomeMoldovaMongoliaMontenegroMoroccoMozambiqueMyanmarNamibiaNauruNepalNetherlandsNew ZealandNicaraguaNigerNigeriaNorth AmericaNorwayOECD membersOmanOther small statesPacific island small statesPakistanPalauPanamaPapua New GuineaParaguayPeruPhilippinesPolandPortugalPost-demographic dividendPre-demographic dividendPuerto RicoQatarRomaniaRussian FederationRwandaSamoaSan MarinoSao Tome and PrincipeSaudi ArabiaSenegalSerbiaSeychellesSierra LeoneSlovak RepublicSloveniaSmall statesSolomon IslandsSomaliaSouth AfricaSouth AsiaSouth Asia (IDA & IBRD)SpainSri LankaSt. Kitts and NevisSt. LuciaSt. Vincent and the GrenadinesSub-Saharan Africa Sub-Saharan Africa (excluding high income)Sub-Saharan Africa (IDA & IBRD countries)SudanSurinameSwazilandSwedenSwitzerlandSyrian Arab RepublicTajikistanTanzaniaThailandTimor-LesteTogoTongaTrinidad and TobagoTunisiaTurkeyTurkmenistanTuvaluUgandaUkraineUnited Arab EmiratesUnited KingdomUnited StatesUpper middle incomeUruguayUzbekistanVanuatuVenezuela, RBVietnamWest Bank and GazaWorldYemen, Rep.ZambiaZimbabwe Timeline:
This timeline shows a graph from 1971 to 2014 of Botswana. No data until 1970. Number of actual observations by date: 37.
Source name:
World Development Indicators
Source organization:
UNESCO Institute for Statistics
Categories, topics:
Education
Last updated:
apr 23, 2017
Indicators value changes by year
Maximum:
83.918
jan 1, 2014
At the date of observation
Value
Absolute change
Change from previous value
jan 1, 1971
6.271
+6.271
0.0%
jan 1, 1972
7.251
+0.98
15.63%
jan 1, 1973
8.183
+0.932
12.86%
jan 1, 1974
11.465
+3.281
40.1%
jan 1, 1975
12.854
+1.39
12.12%
jan 1, 1976
14.577
+1.723
13.4%
jan 1, 1977
16.144
+1.566
10.75%
jan 1, 1978
17.249
+1.105
6.85%
jan 1, 1979
17.766
+0.517
3.0%
jan 1, 1980
17.759
-0.007
-0.04%
jan 1, 1981
18.492
+0.733
4.13%
jan 1, 1982
20.288
+1.796
9.71%
jan 1, 1984
20.766
+0.478
2.36%
jan 1, 1985
24.832
+4.066
19.58%
jan 1, 1986
28.074
+3.242
13.05%
jan 1, 1987
29.812
+1.738
6.19%
jan 1, 1988
31.118
+1.306
4.38%
jan 1, 1989
30.839
-0.279
-0.9%
jan 1, 1990
36.118
+5.279
17.12%
jan 1, 1991
39.767
+3.649
10.1%
jan 1, 1992
48.065
+8.299
20.87%
jan 1, 1993
47.446
-0.62
-1.29%
jan 1, 1994
51.415
+3.969
8.37%
jan 1, 1995
50.218
-1.197
-2.33%
jan 1, 1996
56.892
+6.674
13.29%
jan 1, 1999
72.561
+15.669
27.54%
jan 1, 2000
73.519
+0.959
1.32%
jan 1, 2001
75.214
+1.694
2.3%
jan 1, 2002
74.758
-0.456
-0.61%
jan 1, 2003
75.651
+0.893
1.19%
jan 1, 2004
76.293
+0.642
0.85%
jan 1, 2005
77.834
+1.541
2.02%
jan 1, 2006
78.525
+0.691
0.89%
jan 1, 2007
80.533
+2.008
2.56%
jan 1, 2008
81.372
+0.838
1.04%
jan 1, 2013
82.762
+1.39
1.71%
jan 1, 2014
83.918
+1.156
1.4%
Ranking of countries by current statistics by years


Comments: