29
/
en
AIzaSyAYiBZKx7MnpbEhh9jyipgxe19OcubqV5w
April 1, 2024
144428
Guatemala
GTM
true
2
1
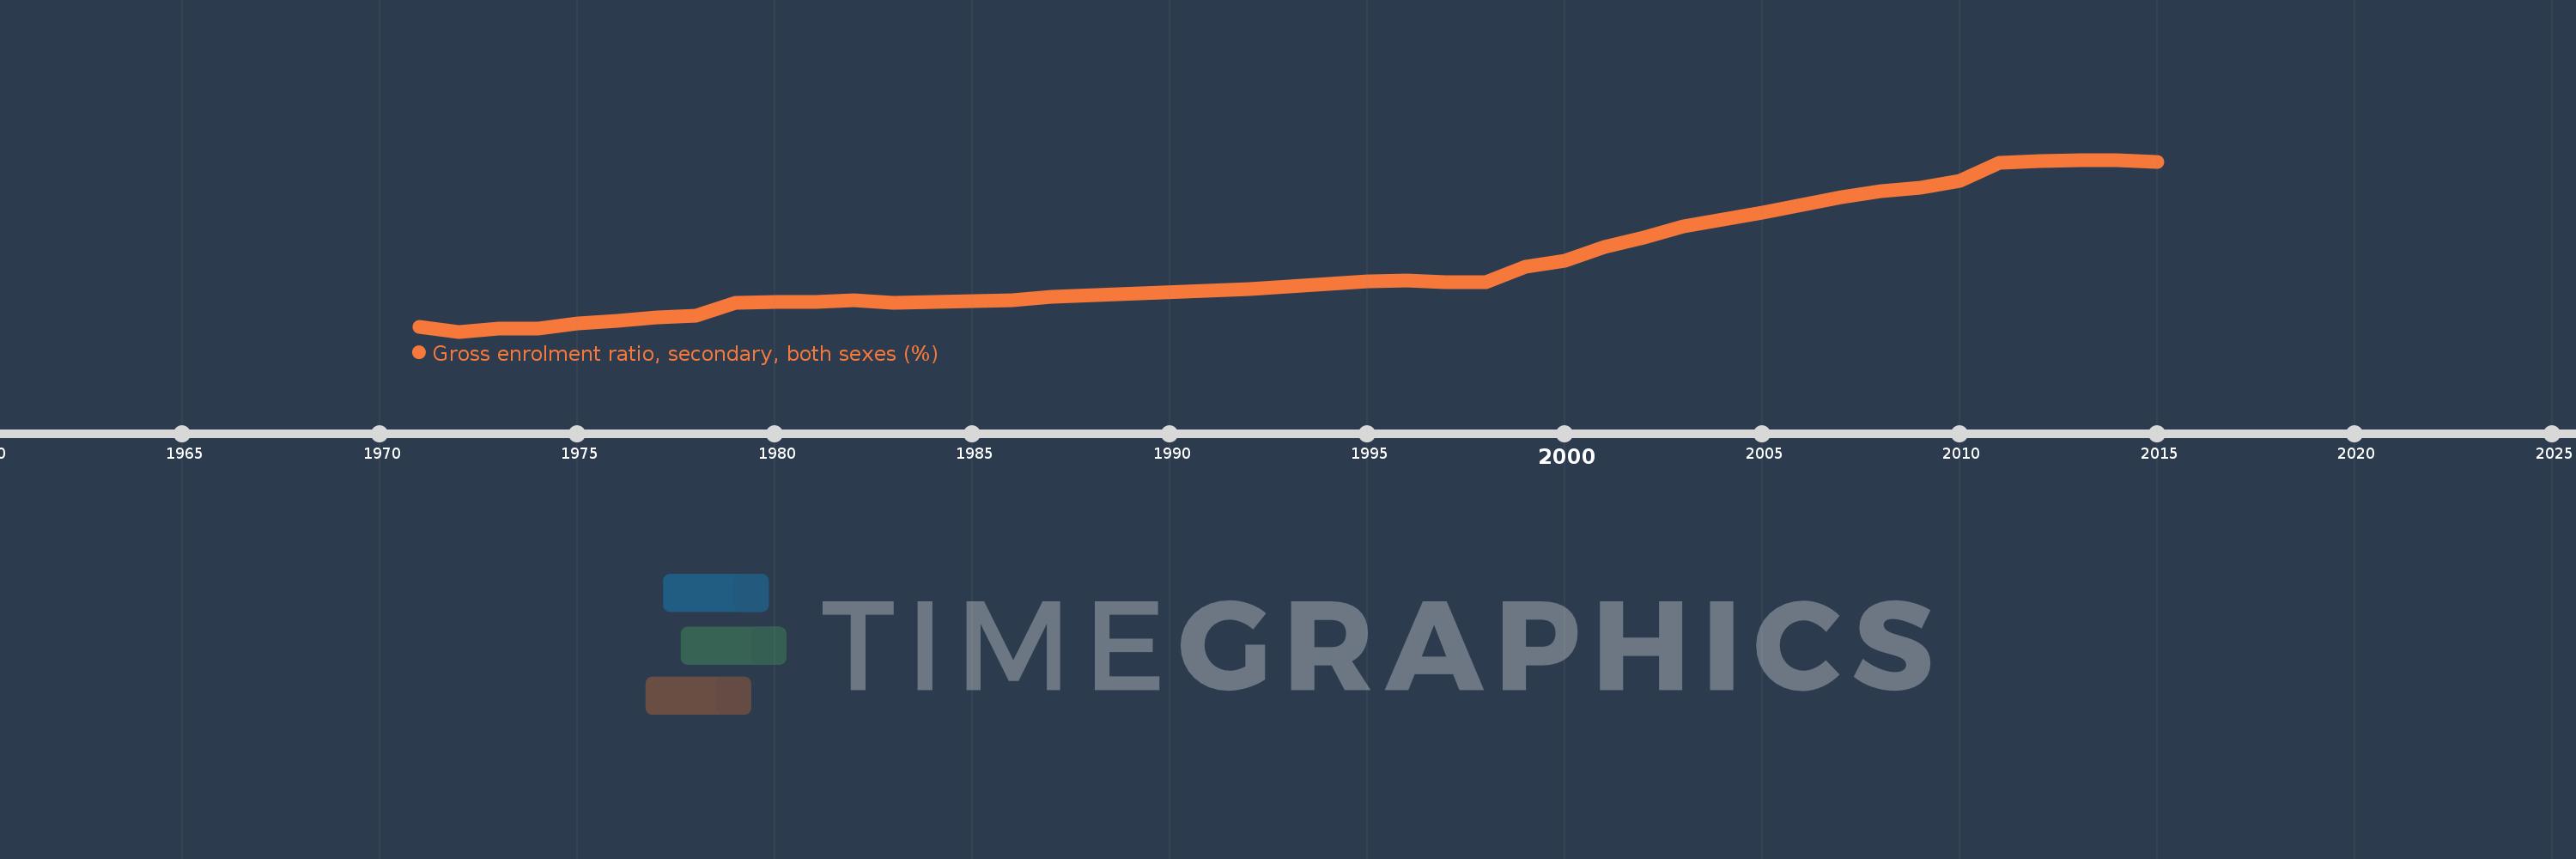
Gross enrolment ratio, secondary, both sexes (%)
2015,2014,2013,2012,2011,2010,2009,2008,2007,2006,2005,2003,2002,2001,2000,1999,1998,1997,1996,1995,1994,1992,1987,1986,1985,1984,1983,1982,1981,1980,1979,1978,1977,1976,1975,1974,1973,1972,1971
This statistics in other country:
AfghanistanAlbaniaAlgeriaAndorraAngolaAntigua and BarbudaArab WorldArgentinaArmeniaArubaAustraliaAustriaAzerbaijanBahamas, TheBahrainBangladeshBarbadosBelarusBelgiumBelizeBeninBermudaBhutanBoliviaBosnia and HerzegovinaBotswanaBrazilBritish Virgin IslandsBrunei DarussalamBulgariaBurkina FasoBurundiCabo VerdeCambodiaCameroonCanadaCaribbean small statesCentral African RepublicCentral Europe and the BalticsChadChileChinaColombiaComorosCongo, Dem. Rep.Congo, Rep.Costa RicaCote d'IvoireCroatiaCubaCuracaoCyprusCzech RepublicDenmarkDjiboutiDominicaDominican RepublicEarly-demographic dividendEast Asia & PacificEast Asia & Pacific (excluding high income)East Asia & Pacific (IDA & IBRD countries)EcuadorEgypt, Arab Rep.El SalvadorEquatorial GuineaEritreaEstoniaEthiopiaEuro areaEurope & Central AsiaEurope & Central Asia (excluding high income)Europe & Central Asia (IDA & IBRD countries)European UnionFijiFinlandFragile and conflict affected situationsFranceGabonGambia, TheGeorgiaGermanyGhanaGreeceGrenadaGuatemalaGuineaGuinea-BissauGuyanaHaitiHeavily indebted poor countries (HIPC)High incomeHondurasHong Kong SAR, ChinaHungaryIBRD onlyIcelandIDA & IBRD totalIDA blendIDA onlyIDA totalIndiaIndonesiaIran, Islamic Rep.IraqIrelandIsraelItalyJamaicaJapanJordanKazakhstanKenyaKiribatiKorea, Dem. People’s Rep.Korea, Rep.KuwaitKyrgyz RepublicLao PDRLate-demographic dividendLatin America & Caribbean Latin America & Caribbean (excluding high income)Latin America & the Caribbean (IDA & IBRD countries)LatviaLeast developed countries: UN classificationLebanonLesothoLiberiaLibyaLiechtensteinLithuaniaLow & middle incomeLow incomeLower middle incomeLuxembourgMacao SAR, ChinaMacedonia, FYRMadagascarMalawiMalaysiaMaldivesMaliMaltaMarshall IslandsMauritaniaMauritiusMexicoMicronesia, Fed. Sts.Middle East & North AfricaMiddle East & North Africa (excluding high income)Middle East & North Africa (IDA & IBRD countries)Middle incomeMoldovaMongoliaMontenegroMoroccoMozambiqueMyanmarNamibiaNauruNepalNetherlandsNew ZealandNicaraguaNigerNigeriaNorth AmericaNorwayOECD membersOmanOther small statesPacific island small statesPakistanPalauPanamaPapua New GuineaParaguayPeruPhilippinesPolandPortugalPost-demographic dividendPre-demographic dividendPuerto RicoQatarRomaniaRussian FederationRwandaSamoaSan MarinoSao Tome and PrincipeSaudi ArabiaSenegalSerbiaSeychellesSierra LeoneSlovak RepublicSloveniaSmall statesSolomon IslandsSomaliaSouth AfricaSouth AsiaSouth Asia (IDA & IBRD)SpainSri LankaSt. Kitts and NevisSt. LuciaSt. Vincent and the GrenadinesSub-Saharan Africa Sub-Saharan Africa (excluding high income)Sub-Saharan Africa (IDA & IBRD countries)SudanSurinameSwazilandSwedenSwitzerlandSyrian Arab RepublicTajikistanTanzaniaThailandTimor-LesteTogoTongaTrinidad and TobagoTunisiaTurkeyTurkmenistanTuvaluUgandaUkraineUnited Arab EmiratesUnited KingdomUnited StatesUpper middle incomeUruguayUzbekistanVanuatuVenezuela, RBVietnamWest Bank and GazaWorldYemen, Rep.ZambiaZimbabwe Timeline:
This timeline shows a graph from 1971 to 2015 of Guatemala. No data until 1970. Number of actual observations by date: 39.
Source name:
World Development Indicators
Source organization:
UNESCO Institute for Statistics
Categories, topics:
Education
Last updated:
apr 23, 2017
Indicators value changes by year
Maximum:
64.156
jan 1, 2014
At the date of observation
Value
Absolute change
Change from previous value
jan 1, 1971
10.293
+10.293
0.0%
jan 1, 1972
8.818
-1.475
-14.33%
jan 1, 1973
9.688
+0.871
9.87%
jan 1, 1974
9.697
+0.009
0.09%
jan 1, 1975
11.389
+1.692
17.45%
jan 1, 1976
12.158
+0.768
6.75%
jan 1, 1977
13.315
+1.157
9.52%
jan 1, 1978
13.882
+0.567
4.26%
jan 1, 1979
18.013
+4.131
29.76%
jan 1, 1980
18.476
+0.463
2.57%
jan 1, 1981
18.349
-0.127
-0.69%
jan 1, 1982
18.95
+0.601
3.27%
jan 1, 1983
18.079
-0.871
-4.59%
jan 1, 1984
18.352
+0.273
1.51%
jan 1, 1985
18.599
+0.246
1.34%
jan 1, 1986
18.883
+0.284
1.53%
jan 1, 1987
20.139
+1.256
6.65%
jan 1, 1992
22.628
+2.489
12.36%
jan 1, 1994
24.135
+1.507
6.66%
jan 1, 1995
25.012
+0.877
3.63%
jan 1, 1996
25.148
+0.135
0.54%
jan 1, 1997
24.736
-0.411
-1.64%
jan 1, 1998
24.708
-0.029
-0.12%
jan 1, 1999
29.595
+4.888
19.78%
jan 1, 2000
31.628
+2.033
6.87%
jan 1, 2001
36.164
+4.535
14.34%
jan 1, 2002
39.003
+2.839
7.85%
jan 1, 2003
42.805
+3.803
9.75%
jan 1, 2005
47.264
+4.459
10.42%
jan 1, 2006
49.759
+2.494
5.28%
jan 1, 2007
52.003
+2.245
4.51%
jan 1, 2008
54.102
+2.099
4.04%
jan 1, 2009
55.126
+1.024
1.89%
jan 1, 2010
57.328
+2.203
4.0%
jan 1, 2011
63.143
+5.815
10.14%
jan 1, 2012
63.743
+0.6
0.95%
jan 1, 2013
64.071
+0.328
0.51%
jan 1, 2014
64.156
+0.085
0.13%
jan 1, 2015
63.531
-0.625
-0.97%
Ranking of countries by current statistics by years


Comments: