29
/
en
AIzaSyAYiBZKx7MnpbEhh9jyipgxe19OcubqV5w
April 1, 2024
54095
Pacific island small states
PSS
false
2
1
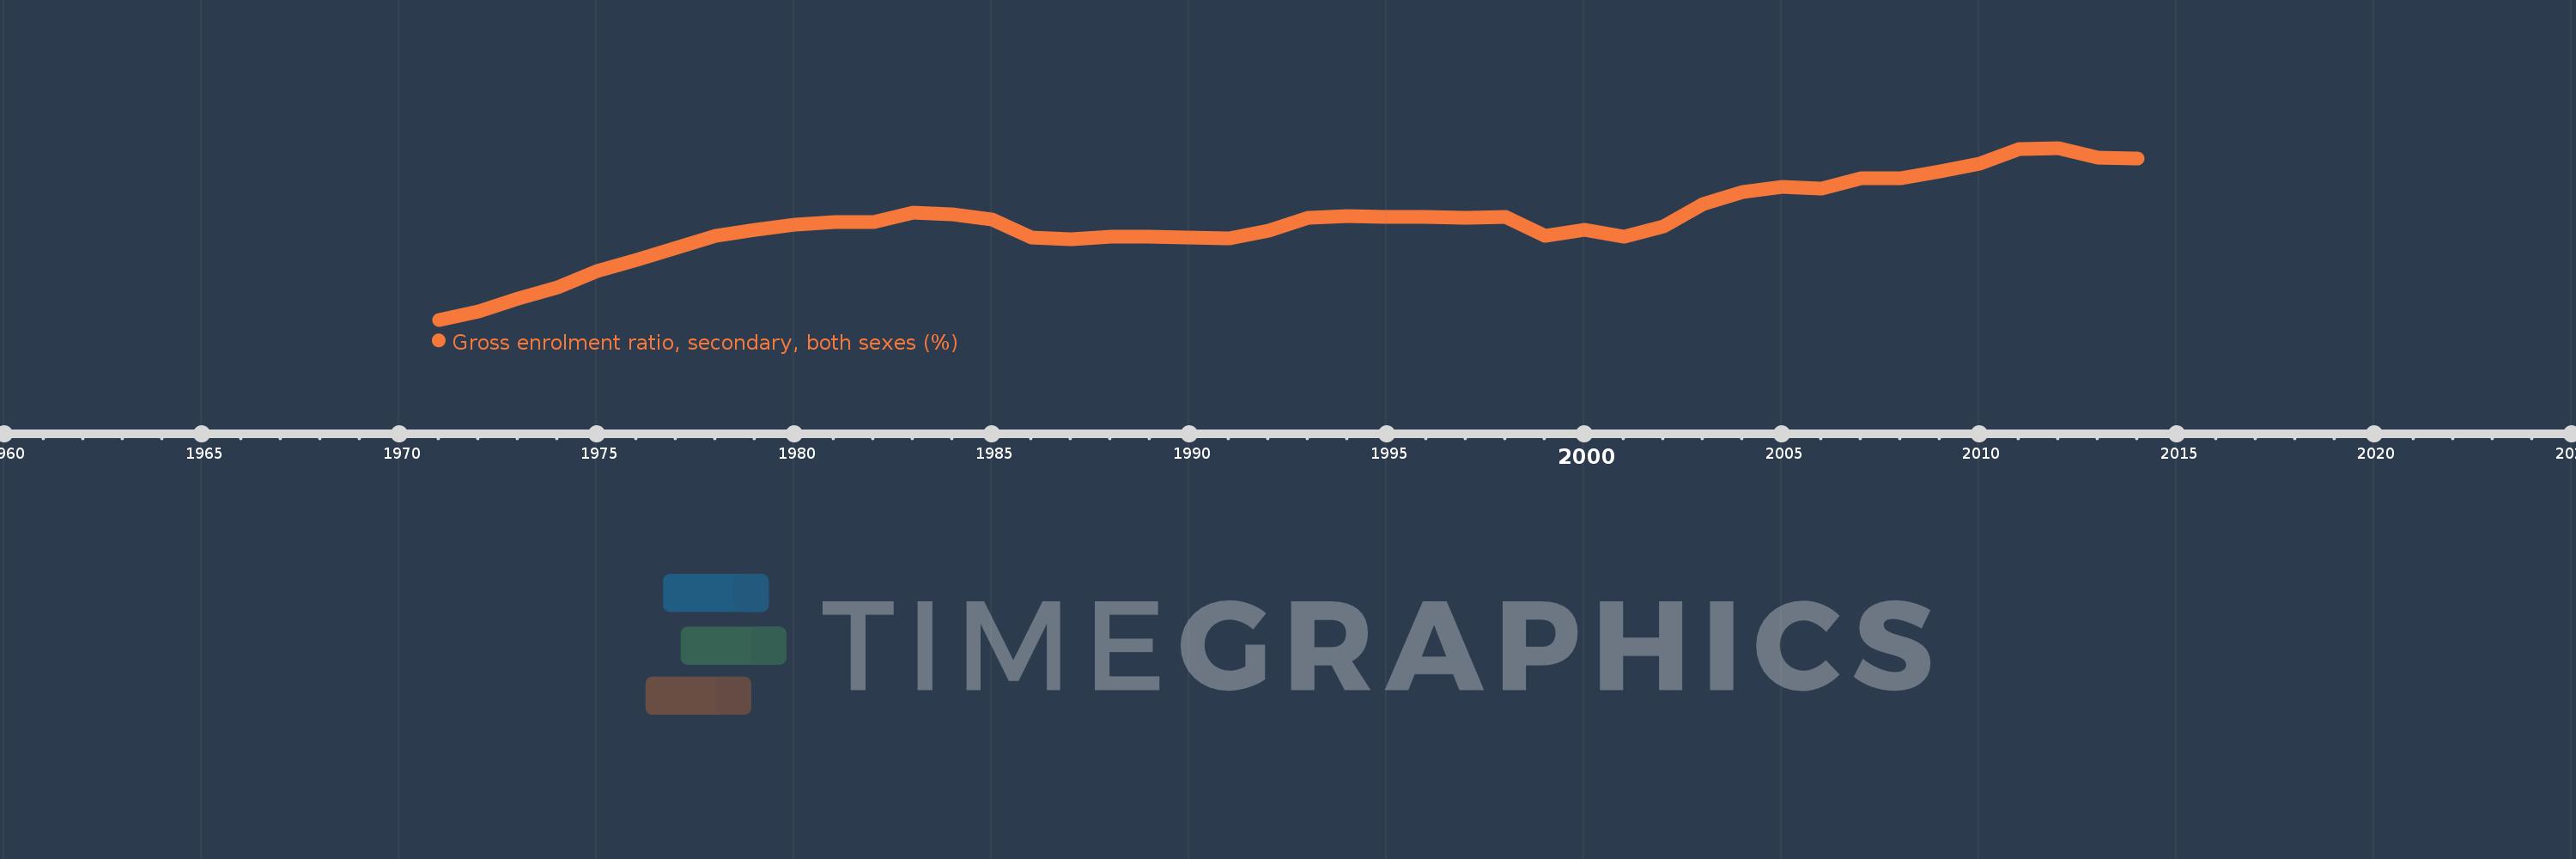
Gross enrolment ratio, secondary, both sexes (%)
2014,2013,2012,2011,2010,2009,2008,2007,2006,2005,2004,2003,2002,2001,2000,1999,1998,1997,1996,1995,1994,1993,1992,1991,1990,1989,1988,1987,1986,1985,1984,1983,1982,1981,1980,1979,1978,1977,1976,1975,1974,1973,1972,1971
This statistics in other country:
AfghanistanAlbaniaAlgeriaAndorraAngolaAntigua and BarbudaArab WorldArgentinaArmeniaArubaAustraliaAustriaAzerbaijanBahamas, TheBahrainBangladeshBarbadosBelarusBelgiumBelizeBeninBermudaBhutanBoliviaBosnia and HerzegovinaBotswanaBrazilBritish Virgin IslandsBrunei DarussalamBulgariaBurkina FasoBurundiCabo VerdeCambodiaCameroonCanadaCaribbean small statesCentral African RepublicCentral Europe and the BalticsChadChileChinaColombiaComorosCongo, Dem. Rep.Congo, Rep.Costa RicaCote d'IvoireCroatiaCubaCuracaoCyprusCzech RepublicDenmarkDjiboutiDominicaDominican RepublicEarly-demographic dividendEast Asia & PacificEast Asia & Pacific (excluding high income)East Asia & Pacific (IDA & IBRD countries)EcuadorEgypt, Arab Rep.El SalvadorEquatorial GuineaEritreaEstoniaEthiopiaEuro areaEurope & Central AsiaEurope & Central Asia (excluding high income)Europe & Central Asia (IDA & IBRD countries)European UnionFijiFinlandFragile and conflict affected situationsFranceGabonGambia, TheGeorgiaGermanyGhanaGreeceGrenadaGuatemalaGuineaGuinea-BissauGuyanaHaitiHeavily indebted poor countries (HIPC)High incomeHondurasHong Kong SAR, ChinaHungaryIBRD onlyIcelandIDA & IBRD totalIDA blendIDA onlyIDA totalIndiaIndonesiaIran, Islamic Rep.IraqIrelandIsraelItalyJamaicaJapanJordanKazakhstanKenyaKiribatiKorea, Dem. People’s Rep.Korea, Rep.KuwaitKyrgyz RepublicLao PDRLate-demographic dividendLatin America & Caribbean Latin America & Caribbean (excluding high income)Latin America & the Caribbean (IDA & IBRD countries)LatviaLeast developed countries: UN classificationLebanonLesothoLiberiaLibyaLiechtensteinLithuaniaLow & middle incomeLow incomeLower middle incomeLuxembourgMacao SAR, ChinaMacedonia, FYRMadagascarMalawiMalaysiaMaldivesMaliMaltaMarshall IslandsMauritaniaMauritiusMexicoMicronesia, Fed. Sts.Middle East & North AfricaMiddle East & North Africa (excluding high income)Middle East & North Africa (IDA & IBRD countries)Middle incomeMoldovaMongoliaMontenegroMoroccoMozambiqueMyanmarNamibiaNauruNepalNetherlandsNew ZealandNicaraguaNigerNigeriaNorth AmericaNorwayOECD membersOmanOther small statesPacific island small statesPakistanPalauPanamaPapua New GuineaParaguayPeruPhilippinesPolandPortugalPost-demographic dividendPre-demographic dividendPuerto RicoQatarRomaniaRussian FederationRwandaSamoaSan MarinoSao Tome and PrincipeSaudi ArabiaSenegalSerbiaSeychellesSierra LeoneSlovak RepublicSloveniaSmall statesSolomon IslandsSomaliaSouth AfricaSouth AsiaSouth Asia (IDA & IBRD)SpainSri LankaSt. Kitts and NevisSt. LuciaSt. Vincent and the GrenadinesSub-Saharan Africa Sub-Saharan Africa (excluding high income)Sub-Saharan Africa (IDA & IBRD countries)SudanSurinameSwazilandSwedenSwitzerlandSyrian Arab RepublicTajikistanTanzaniaThailandTimor-LesteTogoTongaTrinidad and TobagoTunisiaTurkeyTurkmenistanTuvaluUgandaUkraineUnited Arab EmiratesUnited KingdomUnited StatesUpper middle incomeUruguayUzbekistanVanuatuVenezuela, RBVietnamWest Bank and GazaWorldYemen, Rep.ZambiaZimbabwe Timeline:
This timeline shows a graph from 1971 to 2014 of Pacific island small states. No data until 1970. Number of actual observations by date: 44.
Source name:
World Development Indicators
Source organization:
UNESCO Institute for Statistics
Categories, topics:
Education
Last updated:
apr 23, 2017
Indicators value changes by year
Minimum:
50.493
jan 1, 1971
Maximum:
75.807
jan 1, 2012
At the date of observation
Value
Absolute change
Change from previous value
jan 1, 1971
50.493
+50.493
0.0%
jan 1, 1972
51.748
+1.255
2.49%
jan 1, 1973
53.643
+1.895
3.66%
jan 1, 1974
55.24
+1.596
2.98%
jan 1, 1975
57.728
+2.489
4.51%
jan 1, 1976
59.311
+1.582
2.74%
jan 1, 1977
61.029
+1.719
2.9%
jan 1, 1978
62.863
+1.833
3.0%
jan 1, 1979
63.684
+0.821
1.31%
jan 1, 1980
64.567
+0.883
1.39%
jan 1, 1981
64.826
+0.259
0.4%
jan 1, 1982
64.835
+0.01
0.01%
jan 1, 1983
66.221
+1.386
2.14%
jan 1, 1984
66.068
-0.153
-0.23%
jan 1, 1985
65.224
-0.843
-1.28%
jan 1, 1986
62.648
-2.576
-3.95%
jan 1, 1987
62.348
-0.3
-0.48%
jan 1, 1988
62.792
+0.444
0.71%
jan 1, 1989
62.691
-0.101
-0.16%
jan 1, 1990
62.66
-0.03
-0.05%
jan 1, 1991
62.535
-0.125
-0.2%
jan 1, 1992
63.626
+1.091
1.74%
jan 1, 1993
65.564
+1.939
3.05%
jan 1, 1994
65.79
+0.226
0.34%
jan 1, 1995
65.647
-0.143
-0.22%
jan 1, 1996
65.611
-0.036
-0.05%
jan 1, 1997
65.488
-0.123
-0.19%
jan 1, 1998
65.698
+0.21
0.32%
jan 1, 1999
62.876
-2.823
-4.3%
jan 1, 2000
63.728
+0.852
1.36%
jan 1, 2001
62.77
-0.958
-1.5%
jan 1, 2002
64.314
+1.544
2.46%
jan 1, 2003
67.585
+3.27
5.09%
jan 1, 2004
69.267
+1.682
2.49%
jan 1, 2005
70.131
+0.864
1.25%
jan 1, 2006
69.78
-0.351
-0.5%
jan 1, 2007
71.334
+1.554
2.23%
jan 1, 2008
71.318
-0.016
-0.02%
jan 1, 2009
72.379
+1.062
1.49%
jan 1, 2010
73.553
+1.173
1.62%
jan 1, 2011
75.703
+2.151
2.92%
jan 1, 2012
75.807
+0.103
0.14%
jan 1, 2013
74.392
-1.414
-1.87%
jan 1, 2014
74.215
-0.178
-0.24%
Ranking of countries by current statistics by years


Comments: