29
/
en
AIzaSyAYiBZKx7MnpbEhh9jyipgxe19OcubqV5w
April 1, 2024
287263
Zimbabwe
ZWE
true
2
1
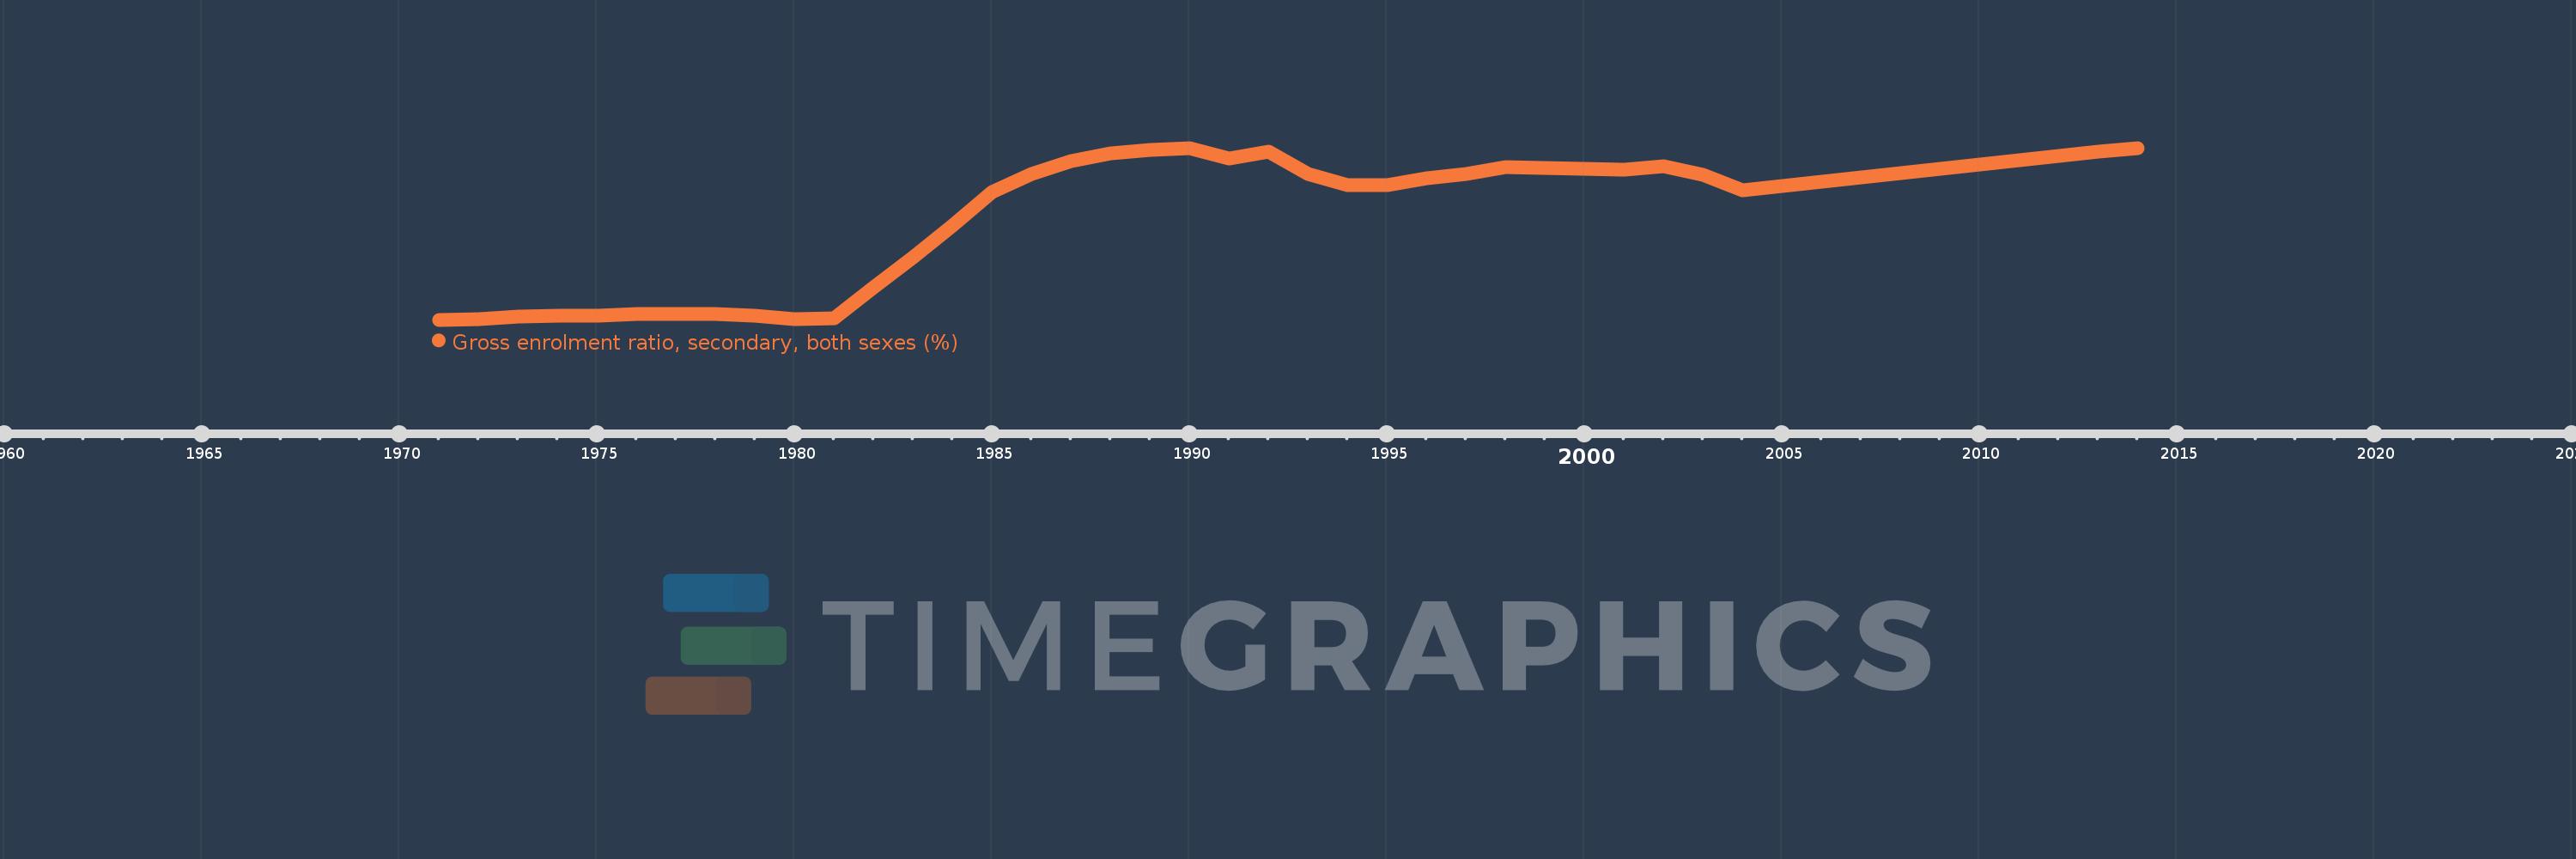
Gross enrolment ratio, secondary, both sexes (%)
2014,2013,2004,2003,2002,2001,2000,1998,1997,1996,1995,1994,1993,1992,1991,1990,1989,1988,1987,1986,1985,1984,1983,1982,1981,1980,1979,1978,1977,1976,1975,1974,1973,1972,1971
This statistics in other country:
AfghanistanAlbaniaAlgeriaAndorraAngolaAntigua and BarbudaArab WorldArgentinaArmeniaArubaAustraliaAustriaAzerbaijanBahamas, TheBahrainBangladeshBarbadosBelarusBelgiumBelizeBeninBermudaBhutanBoliviaBosnia and HerzegovinaBotswanaBrazilBritish Virgin IslandsBrunei DarussalamBulgariaBurkina FasoBurundiCabo VerdeCambodiaCameroonCanadaCaribbean small statesCentral African RepublicCentral Europe and the BalticsChadChileChinaColombiaComorosCongo, Dem. Rep.Congo, Rep.Costa RicaCote d'IvoireCroatiaCubaCuracaoCyprusCzech RepublicDenmarkDjiboutiDominicaDominican RepublicEarly-demographic dividendEast Asia & PacificEast Asia & Pacific (excluding high income)East Asia & Pacific (IDA & IBRD countries)EcuadorEgypt, Arab Rep.El SalvadorEquatorial GuineaEritreaEstoniaEthiopiaEuro areaEurope & Central AsiaEurope & Central Asia (excluding high income)Europe & Central Asia (IDA & IBRD countries)European UnionFijiFinlandFragile and conflict affected situationsFranceGabonGambia, TheGeorgiaGermanyGhanaGreeceGrenadaGuatemalaGuineaGuinea-BissauGuyanaHaitiHeavily indebted poor countries (HIPC)High incomeHondurasHong Kong SAR, ChinaHungaryIBRD onlyIcelandIDA & IBRD totalIDA blendIDA onlyIDA totalIndiaIndonesiaIran, Islamic Rep.IraqIrelandIsraelItalyJamaicaJapanJordanKazakhstanKenyaKiribatiKorea, Dem. People’s Rep.Korea, Rep.KuwaitKyrgyz RepublicLao PDRLate-demographic dividendLatin America & Caribbean Latin America & Caribbean (excluding high income)Latin America & the Caribbean (IDA & IBRD countries)LatviaLeast developed countries: UN classificationLebanonLesothoLiberiaLibyaLiechtensteinLithuaniaLow & middle incomeLow incomeLower middle incomeLuxembourgMacao SAR, ChinaMacedonia, FYRMadagascarMalawiMalaysiaMaldivesMaliMaltaMarshall IslandsMauritaniaMauritiusMexicoMicronesia, Fed. Sts.Middle East & North AfricaMiddle East & North Africa (excluding high income)Middle East & North Africa (IDA & IBRD countries)Middle incomeMoldovaMongoliaMontenegroMoroccoMozambiqueMyanmarNamibiaNauruNepalNetherlandsNew ZealandNicaraguaNigerNigeriaNorth AmericaNorwayOECD membersOmanOther small statesPacific island small statesPakistanPalauPanamaPapua New GuineaParaguayPeruPhilippinesPolandPortugalPost-demographic dividendPre-demographic dividendPuerto RicoQatarRomaniaRussian FederationRwandaSamoaSan MarinoSao Tome and PrincipeSaudi ArabiaSenegalSerbiaSeychellesSierra LeoneSlovak RepublicSloveniaSmall statesSolomon IslandsSomaliaSouth AfricaSouth AsiaSouth Asia (IDA & IBRD)SpainSri LankaSt. Kitts and NevisSt. LuciaSt. Vincent and the GrenadinesSub-Saharan Africa Sub-Saharan Africa (excluding high income)Sub-Saharan Africa (IDA & IBRD countries)SudanSurinameSwazilandSwedenSwitzerlandSyrian Arab RepublicTajikistanTanzaniaThailandTimor-LesteTogoTongaTrinidad and TobagoTunisiaTurkeyTurkmenistanTuvaluUgandaUkraineUnited Arab EmiratesUnited KingdomUnited StatesUpper middle incomeUruguayUzbekistanVanuatuVenezuela, RBVietnamWest Bank and GazaWorldYemen, Rep.ZambiaZimbabwe Timeline:
This timeline shows a graph from 1971 to 2014 of Zimbabwe. No data until 1970. Number of actual observations by date: 35.
Source name:
World Development Indicators
Source organization:
UNESCO Institute for Statistics
Categories, topics:
Education
Last updated:
apr 23, 2017
Indicators value changes by year
At the date of observation
Value
Absolute change
Change from previous value
jan 1, 1971
7.381
+7.381
0.0%
jan 1, 1972
7.568
+0.187
2.53%
jan 1, 1973
8.159
+0.591
7.81%
jan 1, 1974
8.376
+0.217
2.66%
jan 1, 1975
8.422
+0.046
0.55%
jan 1, 1976
8.685
+0.262
3.12%
jan 1, 1977
8.736
+0.051
0.59%
jan 1, 1978
8.786
+0.049
0.57%
jan 1, 1979
8.397
-0.388
-4.42%
jan 1, 1980
7.513
-0.884
-10.53%
jan 1, 1981
7.752
+0.239
3.18%
jan 1, 1982
14.893
+7.14
92.11%
jan 1, 1983
21.921
+7.028
47.19%
jan 1, 1984
29.369
+7.447
33.97%
jan 1, 1985
37.232
+7.863
26.77%
jan 1, 1986
41.506
+4.274
11.48%
jan 1, 1987
44.519
+3.013
7.26%
jan 1, 1988
46.288
+1.769
3.97%
jan 1, 1989
47.138
+0.85
1.84%
jan 1, 1990
47.429
+0.291
0.62%
jan 1, 1991
45.08
-2.349
-4.95%
jan 1, 1992
46.62
+1.539
3.41%
jan 1, 1993
41.524
-5.095
-10.93%
jan 1, 1994
38.963
-2.561
-6.17%
jan 1, 1995
38.907
-0.056
-0.14%
jan 1, 1996
40.507
+1.6
4.11%
jan 1, 1997
41.433
+0.926
2.29%
jan 1, 1998
43.162
+1.73
4.17%
jan 1, 2000
42.722
-0.441
-1.02%
jan 1, 2001
42.562
-0.16
-0.37%
jan 1, 2002
43.339
+0.777
1.82%
jan 1, 2003
41.252
-2.086
-4.81%
jan 1, 2004
37.619
-3.634
-8.81%
jan 1, 2013
46.673
+9.054
24.07%
jan 1, 2014
47.57
+0.897
1.92%
Ranking of countries by current statistics by years


Comments: