29
/
en
AIzaSyAYiBZKx7MnpbEhh9jyipgxe19OcubqV5w
April 1, 2024
52650
OECD members
OED
false
2
1
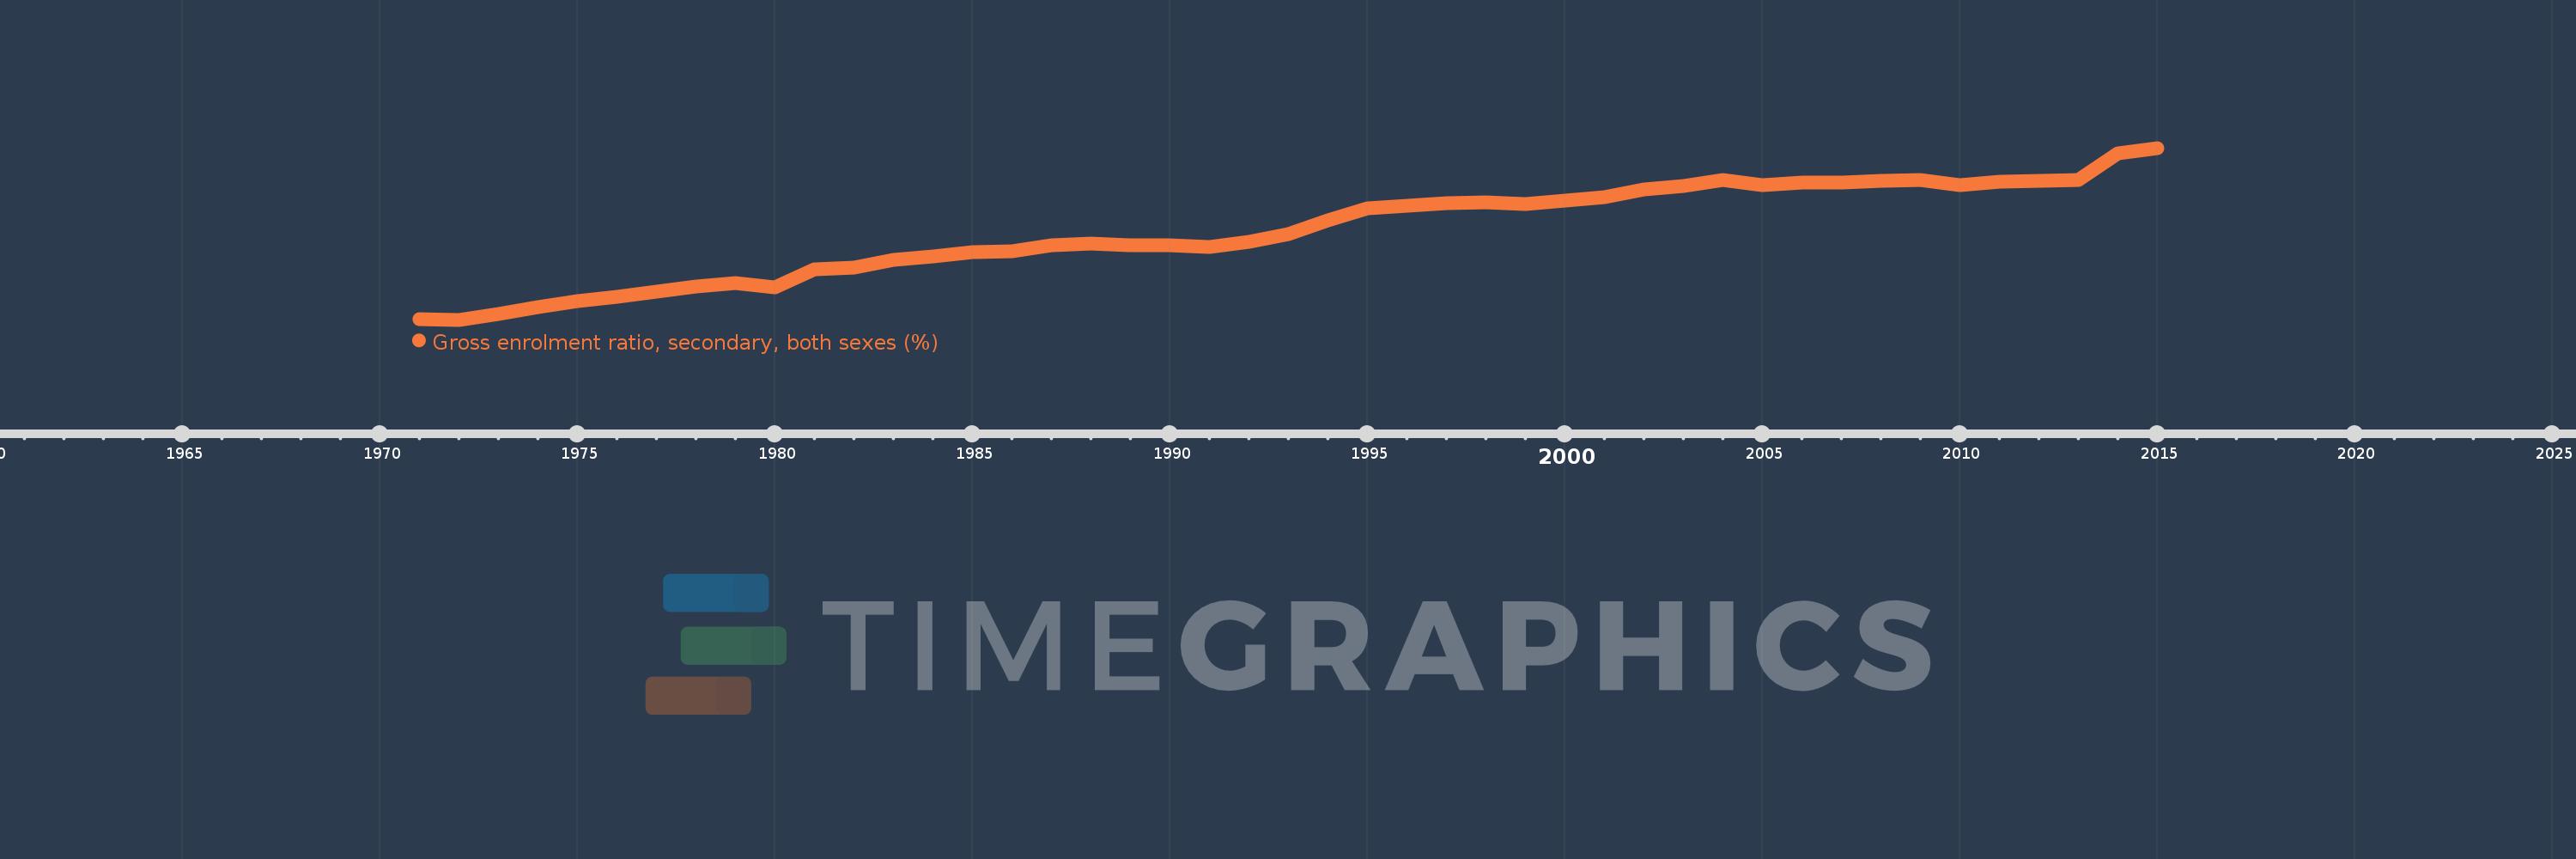
Gross enrolment ratio, secondary, both sexes (%)
2015,2014,2013,2012,2011,2010,2009,2008,2007,2006,2005,2004,2003,2002,2001,2000,1999,1998,1997,1996,1995,1994,1993,1992,1991,1990,1989,1988,1987,1986,1985,1984,1983,1982,1981,1980,1979,1978,1977,1976,1975,1974,1973,1972,1971
This statistics in other country:
AfghanistanAlbaniaAlgeriaAndorraAngolaAntigua and BarbudaArab WorldArgentinaArmeniaArubaAustraliaAustriaAzerbaijanBahamas, TheBahrainBangladeshBarbadosBelarusBelgiumBelizeBeninBermudaBhutanBoliviaBosnia and HerzegovinaBotswanaBrazilBritish Virgin IslandsBrunei DarussalamBulgariaBurkina FasoBurundiCabo VerdeCambodiaCameroonCanadaCaribbean small statesCentral African RepublicCentral Europe and the BalticsChadChileChinaColombiaComorosCongo, Dem. Rep.Congo, Rep.Costa RicaCote d'IvoireCroatiaCubaCuracaoCyprusCzech RepublicDenmarkDjiboutiDominicaDominican RepublicEarly-demographic dividendEast Asia & PacificEast Asia & Pacific (excluding high income)East Asia & Pacific (IDA & IBRD countries)EcuadorEgypt, Arab Rep.El SalvadorEquatorial GuineaEritreaEstoniaEthiopiaEuro areaEurope & Central AsiaEurope & Central Asia (excluding high income)Europe & Central Asia (IDA & IBRD countries)European UnionFijiFinlandFragile and conflict affected situationsFranceGabonGambia, TheGeorgiaGermanyGhanaGreeceGrenadaGuatemalaGuineaGuinea-BissauGuyanaHaitiHeavily indebted poor countries (HIPC)High incomeHondurasHong Kong SAR, ChinaHungaryIBRD onlyIcelandIDA & IBRD totalIDA blendIDA onlyIDA totalIndiaIndonesiaIran, Islamic Rep.IraqIrelandIsraelItalyJamaicaJapanJordanKazakhstanKenyaKiribatiKorea, Dem. People’s Rep.Korea, Rep.KuwaitKyrgyz RepublicLao PDRLate-demographic dividendLatin America & Caribbean Latin America & Caribbean (excluding high income)Latin America & the Caribbean (IDA & IBRD countries)LatviaLeast developed countries: UN classificationLebanonLesothoLiberiaLibyaLiechtensteinLithuaniaLow & middle incomeLow incomeLower middle incomeLuxembourgMacao SAR, ChinaMacedonia, FYRMadagascarMalawiMalaysiaMaldivesMaliMaltaMarshall IslandsMauritaniaMauritiusMexicoMicronesia, Fed. Sts.Middle East & North AfricaMiddle East & North Africa (excluding high income)Middle East & North Africa (IDA & IBRD countries)Middle incomeMoldovaMongoliaMontenegroMoroccoMozambiqueMyanmarNamibiaNauruNepalNetherlandsNew ZealandNicaraguaNigerNigeriaNorth AmericaNorwayOECD membersOmanOther small statesPacific island small statesPakistanPalauPanamaPapua New GuineaParaguayPeruPhilippinesPolandPortugalPost-demographic dividendPre-demographic dividendPuerto RicoQatarRomaniaRussian FederationRwandaSamoaSan MarinoSao Tome and PrincipeSaudi ArabiaSenegalSerbiaSeychellesSierra LeoneSlovak RepublicSloveniaSmall statesSolomon IslandsSomaliaSouth AfricaSouth AsiaSouth Asia (IDA & IBRD)SpainSri LankaSt. Kitts and NevisSt. LuciaSt. Vincent and the GrenadinesSub-Saharan Africa Sub-Saharan Africa (excluding high income)Sub-Saharan Africa (IDA & IBRD countries)SudanSurinameSwazilandSwedenSwitzerlandSyrian Arab RepublicTajikistanTanzaniaThailandTimor-LesteTogoTongaTrinidad and TobagoTunisiaTurkeyTurkmenistanTuvaluUgandaUkraineUnited Arab EmiratesUnited KingdomUnited StatesUpper middle incomeUruguayUzbekistanVanuatuVenezuela, RBVietnamWest Bank and GazaWorldYemen, Rep.ZambiaZimbabwe Timeline:
This timeline shows a graph from 1971 to 2015 of OECD members. No data until 1970. Number of actual observations by date: 45.
Source name:
World Development Indicators
Source organization:
UNESCO Institute for Statistics
Categories, topics:
Education
Last updated:
apr 23, 2017
Indicators value changes by year
Minimum:
71.917
jan 1, 1972
Maximum:
103.943
jan 1, 2015
At the date of observation
Value
Absolute change
Change from previous value
jan 1, 1971
71.997
+71.997
0.0%
jan 1, 1972
71.917
-0.079
-0.11%
jan 1, 1973
72.996
+1.079
1.5%
jan 1, 1974
74.198
+1.202
1.65%
jan 1, 1975
75.438
+1.24
1.67%
jan 1, 1976
76.148
+0.711
0.94%
jan 1, 1977
77.119
+0.97
1.27%
jan 1, 1978
78.179
+1.06
1.37%
jan 1, 1979
78.739
+0.56
0.72%
jan 1, 1980
78.005
-0.733
-0.93%
jan 1, 1981
81.299
+3.293
4.22%
jan 1, 1982
81.711
+0.412
0.51%
jan 1, 1983
83.144
+1.433
1.75%
jan 1, 1984
83.691
+0.547
0.66%
jan 1, 1985
84.544
+0.853
1.02%
jan 1, 1986
84.724
+0.18
0.21%
jan 1, 1987
85.802
+1.079
1.27%
jan 1, 1988
86.142
+0.34
0.4%
jan 1, 1989
85.872
-0.27
-0.31%
jan 1, 1990
85.796
-0.077
-0.09%
jan 1, 1991
85.511
-0.285
-0.33%
jan 1, 1992
86.453
+0.942
1.1%
jan 1, 1993
87.811
+1.359
1.57%
jan 1, 1994
90.458
+2.646
3.01%
jan 1, 1995
92.725
+2.268
2.51%
jan 1, 1996
93.215
+0.49
0.53%
jan 1, 1997
93.644
+0.428
0.46%
jan 1, 1998
93.795
+0.151
0.16%
jan 1, 1999
93.521
-0.274
-0.29%
jan 1, 2000
94.154
+0.633
0.68%
jan 1, 2001
94.824
+0.67
0.71%
jan 1, 2002
96.202
+1.378
1.45%
jan 1, 2003
96.919
+0.717
0.75%
jan 1, 2004
97.998
+1.079
1.11%
jan 1, 2005
96.992
-1.007
-1.03%
jan 1, 2006
97.564
+0.572
0.59%
jan 1, 2007
97.501
-0.063
-0.06%
jan 1, 2008
97.816
+0.316
0.32%
jan 1, 2009
97.997
+0.181
0.19%
jan 1, 2010
96.994
-1.004
-1.02%
jan 1, 2011
97.574
+0.581
0.6%
jan 1, 2012
97.771
+0.197
0.2%
jan 1, 2013
97.941
+0.17
0.17%
jan 1, 2014
102.92
+4.979
5.08%
jan 1, 2015
103.943
+1.024
0.99%
Ranking of countries by current statistics by years


Comments: