29
/
en
AIzaSyAYiBZKx7MnpbEhh9jyipgxe19OcubqV5w
April 1, 2024
224905
Poland
POL
true
2
1
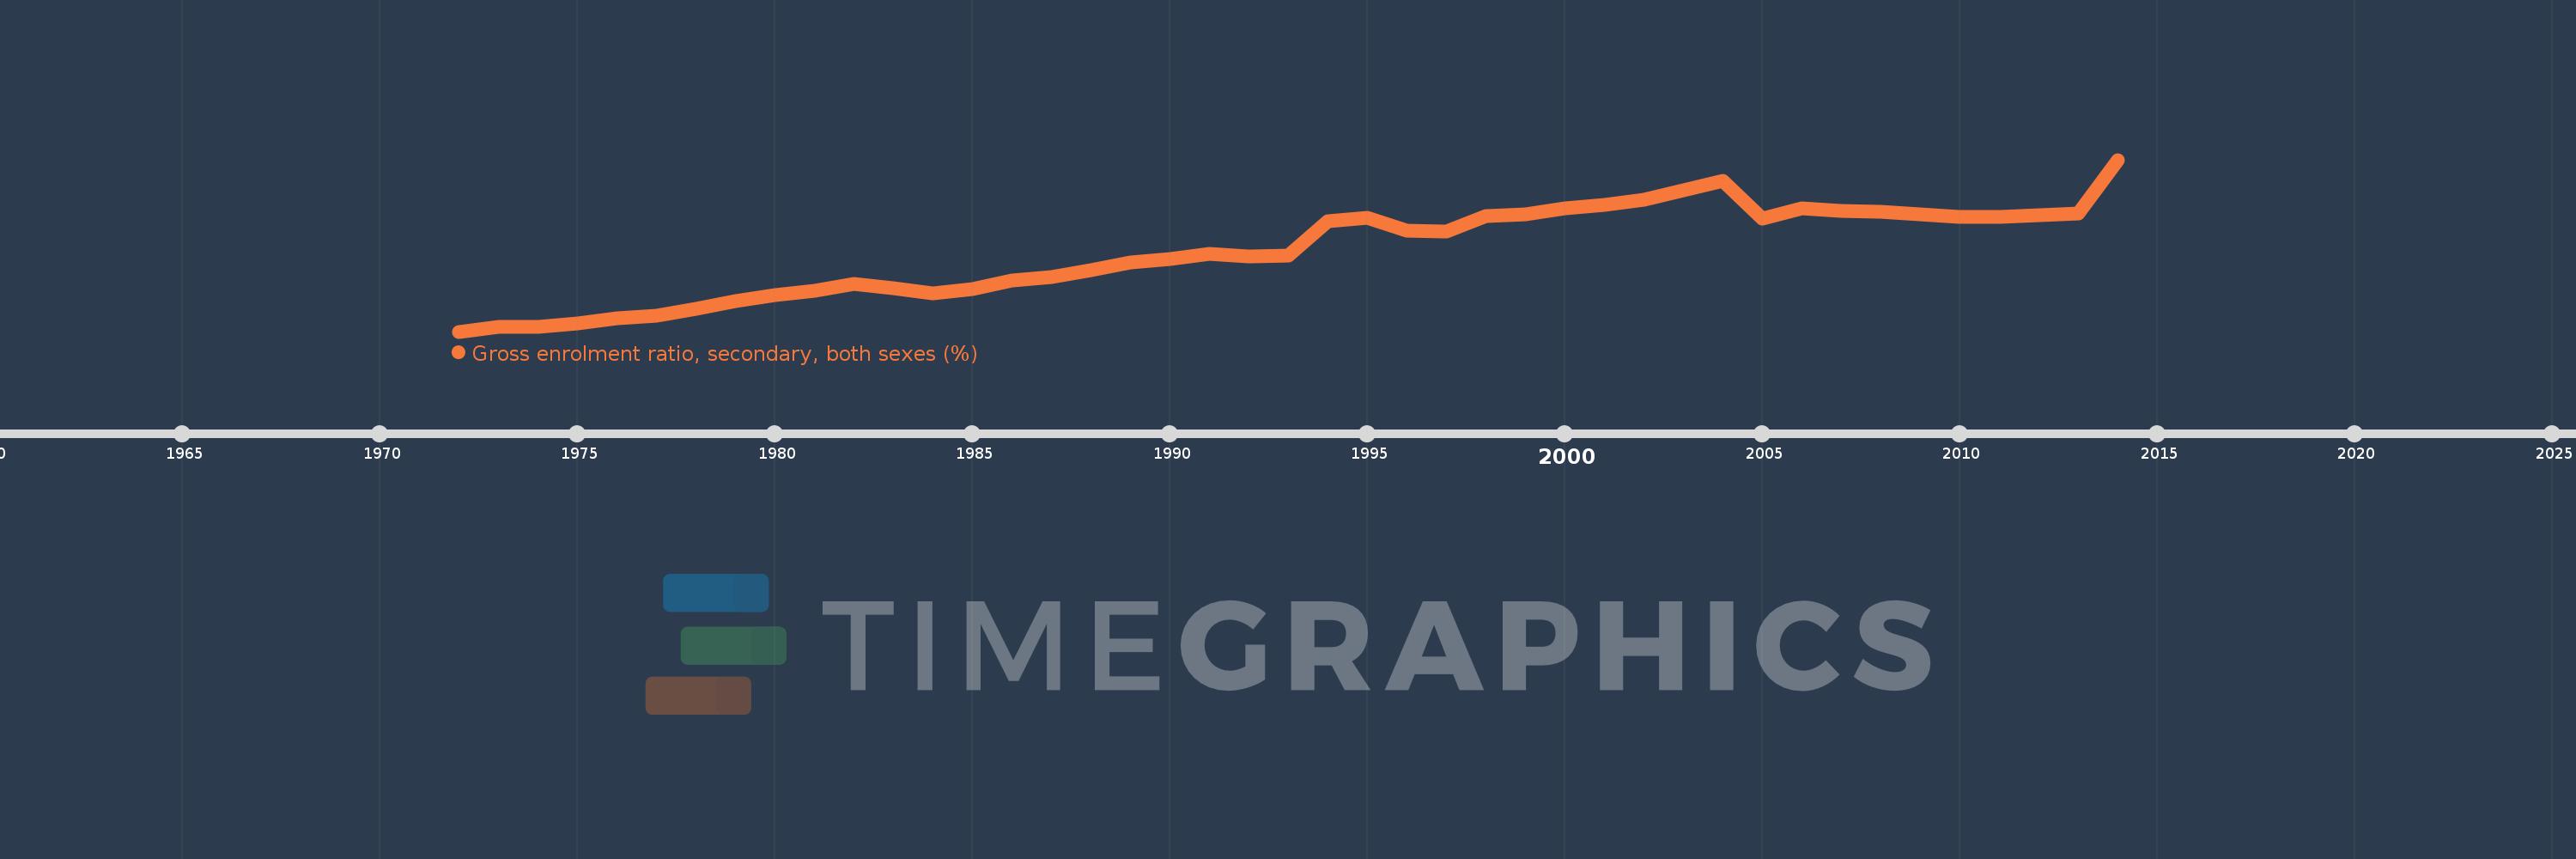
Gross enrolment ratio, secondary, both sexes (%)
2014,2013,2012,2011,2010,2009,2008,2007,2006,2005,2004,2003,2002,2001,2000,1999,1998,1997,1996,1995,1994,1993,1992,1991,1990,1989,1988,1987,1986,1985,1984,1983,1982,1981,1980,1979,1978,1977,1976,1975,1974,1973,1972
This statistics in other country:
AfghanistanAlbaniaAlgeriaAndorraAngolaAntigua and BarbudaArab WorldArgentinaArmeniaArubaAustraliaAustriaAzerbaijanBahamas, TheBahrainBangladeshBarbadosBelarusBelgiumBelizeBeninBermudaBhutanBoliviaBosnia and HerzegovinaBotswanaBrazilBritish Virgin IslandsBrunei DarussalamBulgariaBurkina FasoBurundiCabo VerdeCambodiaCameroonCanadaCaribbean small statesCentral African RepublicCentral Europe and the BalticsChadChileChinaColombiaComorosCongo, Dem. Rep.Congo, Rep.Costa RicaCote d'IvoireCroatiaCubaCuracaoCyprusCzech RepublicDenmarkDjiboutiDominicaDominican RepublicEarly-demographic dividendEast Asia & PacificEast Asia & Pacific (excluding high income)East Asia & Pacific (IDA & IBRD countries)EcuadorEgypt, Arab Rep.El SalvadorEquatorial GuineaEritreaEstoniaEthiopiaEuro areaEurope & Central AsiaEurope & Central Asia (excluding high income)Europe & Central Asia (IDA & IBRD countries)European UnionFijiFinlandFragile and conflict affected situationsFranceGabonGambia, TheGeorgiaGermanyGhanaGreeceGrenadaGuatemalaGuineaGuinea-BissauGuyanaHaitiHeavily indebted poor countries (HIPC)High incomeHondurasHong Kong SAR, ChinaHungaryIBRD onlyIcelandIDA & IBRD totalIDA blendIDA onlyIDA totalIndiaIndonesiaIran, Islamic Rep.IraqIrelandIsraelItalyJamaicaJapanJordanKazakhstanKenyaKiribatiKorea, Dem. People’s Rep.Korea, Rep.KuwaitKyrgyz RepublicLao PDRLate-demographic dividendLatin America & Caribbean Latin America & Caribbean (excluding high income)Latin America & the Caribbean (IDA & IBRD countries)LatviaLeast developed countries: UN classificationLebanonLesothoLiberiaLibyaLiechtensteinLithuaniaLow & middle incomeLow incomeLower middle incomeLuxembourgMacao SAR, ChinaMacedonia, FYRMadagascarMalawiMalaysiaMaldivesMaliMaltaMarshall IslandsMauritaniaMauritiusMexicoMicronesia, Fed. Sts.Middle East & North AfricaMiddle East & North Africa (excluding high income)Middle East & North Africa (IDA & IBRD countries)Middle incomeMoldovaMongoliaMontenegroMoroccoMozambiqueMyanmarNamibiaNauruNepalNetherlandsNew ZealandNicaraguaNigerNigeriaNorth AmericaNorwayOECD membersOmanOther small statesPacific island small statesPakistanPalauPanamaPapua New GuineaParaguayPeruPhilippinesPolandPortugalPost-demographic dividendPre-demographic dividendPuerto RicoQatarRomaniaRussian FederationRwandaSamoaSan MarinoSao Tome and PrincipeSaudi ArabiaSenegalSerbiaSeychellesSierra LeoneSlovak RepublicSloveniaSmall statesSolomon IslandsSomaliaSouth AfricaSouth AsiaSouth Asia (IDA & IBRD)SpainSri LankaSt. Kitts and NevisSt. LuciaSt. Vincent and the GrenadinesSub-Saharan Africa Sub-Saharan Africa (excluding high income)Sub-Saharan Africa (IDA & IBRD countries)SudanSurinameSwazilandSwedenSwitzerlandSyrian Arab RepublicTajikistanTanzaniaThailandTimor-LesteTogoTongaTrinidad and TobagoTunisiaTurkeyTurkmenistanTuvaluUgandaUkraineUnited Arab EmiratesUnited KingdomUnited StatesUpper middle incomeUruguayUzbekistanVanuatuVenezuela, RBVietnamWest Bank and GazaWorldYemen, Rep.ZambiaZimbabwe Timeline:
This timeline shows a graph from 1972 to 2014 of Poland. No data until 1971. Number of actual observations by date: 43.
Source name:
World Development Indicators
Source organization:
UNESCO Institute for Statistics
Categories, topics:
Education
Last updated:
apr 23, 2017
Indicators value changes by year
Minimum:
72.607
jan 1, 1972
Maximum:
108.703
jan 1, 2014
At the date of observation
Value
Absolute change
Change from previous value
jan 1, 1972
72.607
+72.607
0.0%
jan 1, 1973
73.559
+0.952
1.31%
jan 1, 1974
73.677
+0.118
0.16%
jan 1, 1975
74.257
+0.58
0.79%
jan 1, 1976
75.38
+1.123
1.51%
jan 1, 1977
76.021
+0.64
0.85%
jan 1, 1978
77.465
+1.445
1.9%
jan 1, 1979
78.955
+1.49
1.92%
jan 1, 1980
80.218
+1.263
1.6%
jan 1, 1981
81.266
+1.048
1.31%
jan 1, 1982
82.559
+1.293
1.59%
jan 1, 1983
81.797
-0.761
-0.92%
jan 1, 1984
80.707
-1.09
-1.33%
jan 1, 1985
81.488
+0.781
0.97%
jan 1, 1986
83.258
+1.77
2.17%
jan 1, 1987
84.109
+0.851
1.02%
jan 1, 1988
85.448
+1.339
1.59%
jan 1, 1989
87.053
+1.605
1.88%
jan 1, 1990
87.798
+0.745
0.86%
jan 1, 1991
88.887
+1.088
1.24%
jan 1, 1992
88.489
-0.398
-0.45%
jan 1, 1993
88.505
+0.016
0.02%
jan 1, 1994
95.73
+7.225
8.16%
jan 1, 1995
96.465
+0.736
0.77%
jan 1, 1996
93.865
-2.6
-2.7%
jan 1, 1997
93.668
-0.197
-0.21%
jan 1, 1998
96.864
+3.196
3.41%
jan 1, 1999
97.284
+0.42
0.43%
jan 1, 2000
98.515
+1.231
1.27%
jan 1, 2001
99.246
+0.732
0.74%
jan 1, 2002
100.381
+1.134
1.14%
jan 1, 2003
102.368
+1.987
1.98%
jan 1, 2004
104.194
+1.826
1.78%
jan 1, 2005
96.251
-7.942
-7.62%
jan 1, 2006
98.478
+2.227
2.31%
jan 1, 2007
97.939
-0.539
-0.55%
jan 1, 2008
97.694
-0.245
-0.25%
jan 1, 2009
97.18
-0.514
-0.53%
jan 1, 2010
96.677
-0.503
-0.52%
jan 1, 2011
96.734
+0.057
0.06%
jan 1, 2012
96.988
+0.254
0.26%
jan 1, 2013
97.441
+0.453
0.47%
jan 1, 2014
108.703
+11.261
11.56%
Ranking of countries by current statistics by years


Comments: