29
/
en
AIzaSyAYiBZKx7MnpbEhh9jyipgxe19OcubqV5w
April 1, 2024
42424
Latin America & Caribbean (excluding high income)
LAC
false
2
1
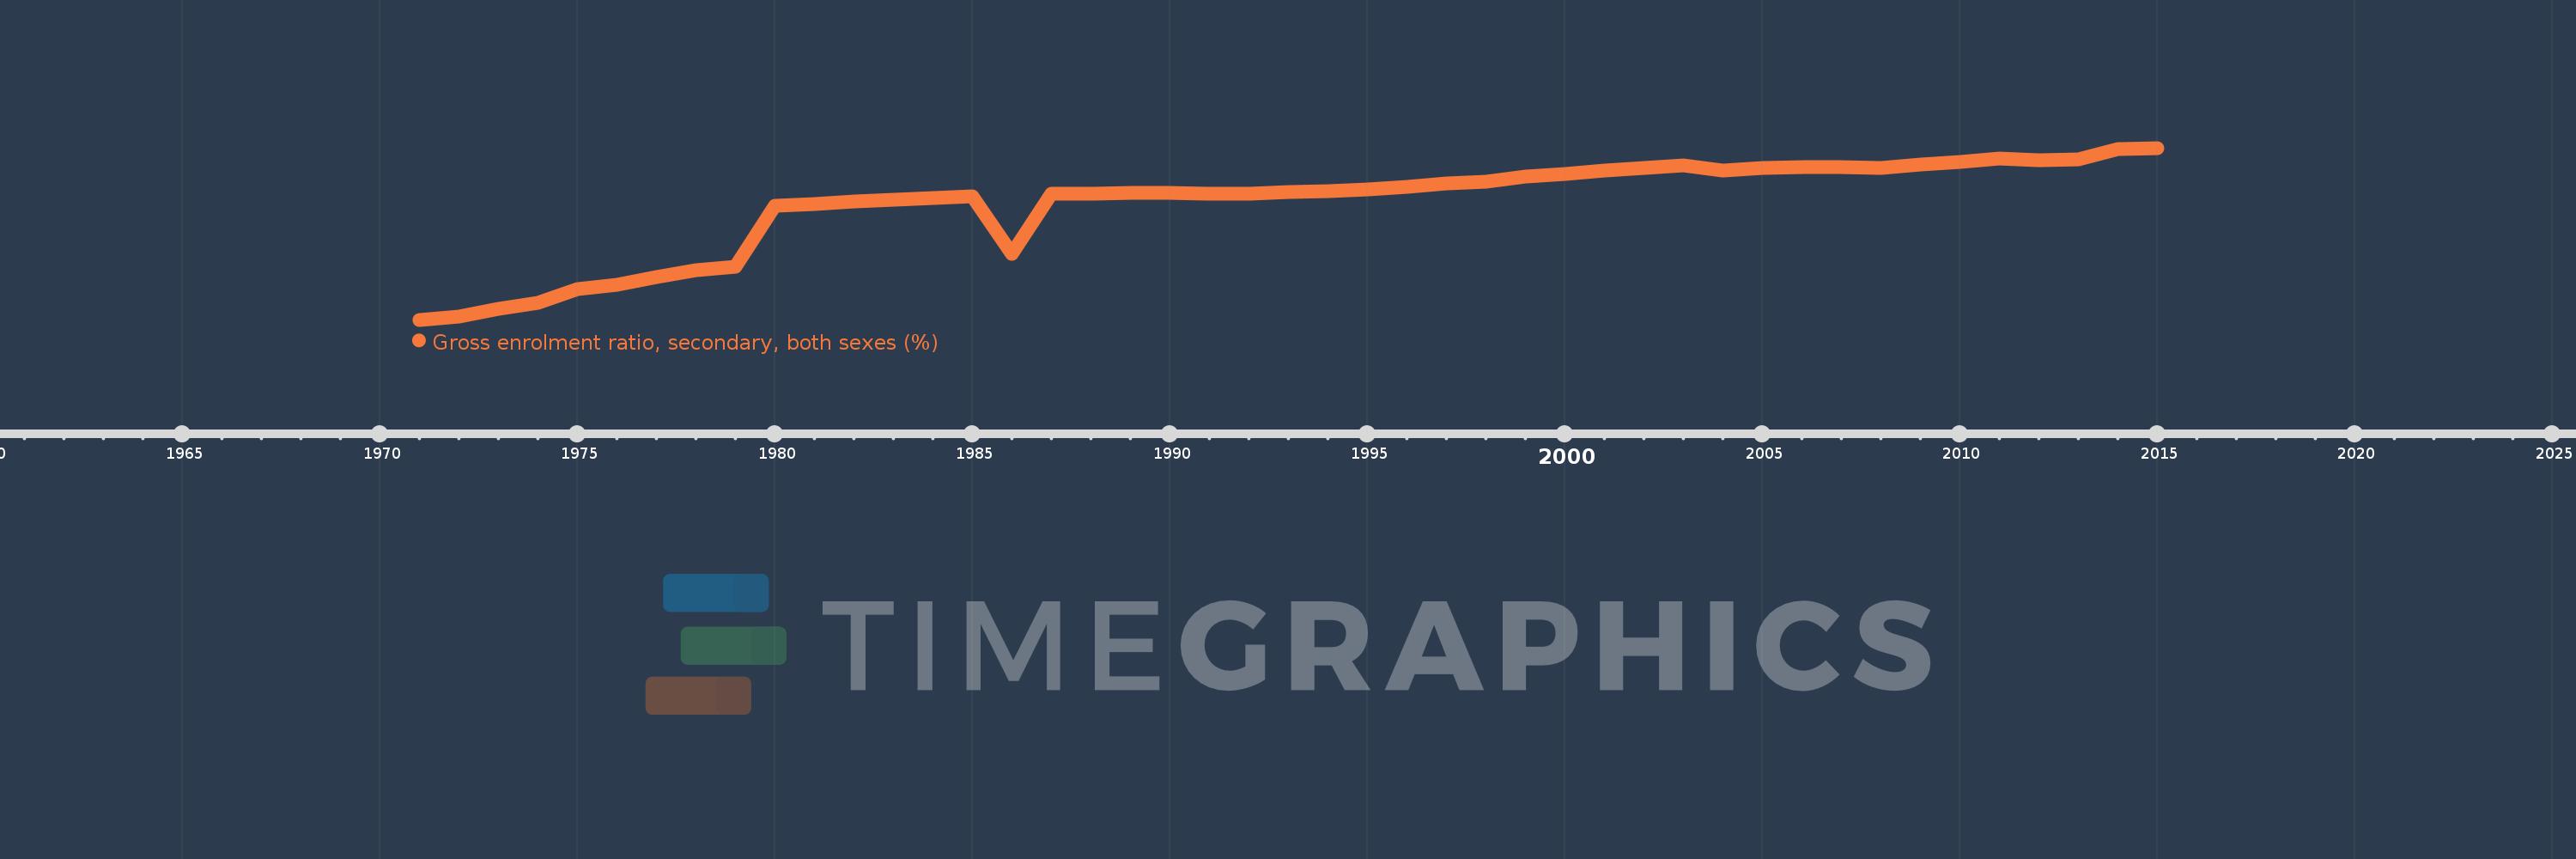
Gross enrolment ratio, secondary, both sexes (%)
2015,2014,2013,2012,2011,2010,2009,2008,2007,2006,2005,2004,2003,2002,2001,2000,1999,1998,1997,1996,1995,1994,1993,1992,1991,1990,1989,1988,1987,1986,1985,1984,1983,1982,1981,1980,1979,1978,1977,1976,1975,1974,1973,1972,1971
This statistics in other country:
AfghanistanAlbaniaAlgeriaAndorraAngolaAntigua and BarbudaArab WorldArgentinaArmeniaArubaAustraliaAustriaAzerbaijanBahamas, TheBahrainBangladeshBarbadosBelarusBelgiumBelizeBeninBermudaBhutanBoliviaBosnia and HerzegovinaBotswanaBrazilBritish Virgin IslandsBrunei DarussalamBulgariaBurkina FasoBurundiCabo VerdeCambodiaCameroonCanadaCaribbean small statesCentral African RepublicCentral Europe and the BalticsChadChileChinaColombiaComorosCongo, Dem. Rep.Congo, Rep.Costa RicaCote d'IvoireCroatiaCubaCuracaoCyprusCzech RepublicDenmarkDjiboutiDominicaDominican RepublicEarly-demographic dividendEast Asia & PacificEast Asia & Pacific (excluding high income)East Asia & Pacific (IDA & IBRD countries)EcuadorEgypt, Arab Rep.El SalvadorEquatorial GuineaEritreaEstoniaEthiopiaEuro areaEurope & Central AsiaEurope & Central Asia (excluding high income)Europe & Central Asia (IDA & IBRD countries)European UnionFijiFinlandFragile and conflict affected situationsFranceGabonGambia, TheGeorgiaGermanyGhanaGreeceGrenadaGuatemalaGuineaGuinea-BissauGuyanaHaitiHeavily indebted poor countries (HIPC)High incomeHondurasHong Kong SAR, ChinaHungaryIBRD onlyIcelandIDA & IBRD totalIDA blendIDA onlyIDA totalIndiaIndonesiaIran, Islamic Rep.IraqIrelandIsraelItalyJamaicaJapanJordanKazakhstanKenyaKiribatiKorea, Dem. People’s Rep.Korea, Rep.KuwaitKyrgyz RepublicLao PDRLate-demographic dividendLatin America & Caribbean Latin America & Caribbean (excluding high income)Latin America & the Caribbean (IDA & IBRD countries)LatviaLeast developed countries: UN classificationLebanonLesothoLiberiaLibyaLiechtensteinLithuaniaLow & middle incomeLow incomeLower middle incomeLuxembourgMacao SAR, ChinaMacedonia, FYRMadagascarMalawiMalaysiaMaldivesMaliMaltaMarshall IslandsMauritaniaMauritiusMexicoMicronesia, Fed. Sts.Middle East & North AfricaMiddle East & North Africa (excluding high income)Middle East & North Africa (IDA & IBRD countries)Middle incomeMoldovaMongoliaMontenegroMoroccoMozambiqueMyanmarNamibiaNauruNepalNetherlandsNew ZealandNicaraguaNigerNigeriaNorth AmericaNorwayOECD membersOmanOther small statesPacific island small statesPakistanPalauPanamaPapua New GuineaParaguayPeruPhilippinesPolandPortugalPost-demographic dividendPre-demographic dividendPuerto RicoQatarRomaniaRussian FederationRwandaSamoaSan MarinoSao Tome and PrincipeSaudi ArabiaSenegalSerbiaSeychellesSierra LeoneSlovak RepublicSloveniaSmall statesSolomon IslandsSomaliaSouth AfricaSouth AsiaSouth Asia (IDA & IBRD)SpainSri LankaSt. Kitts and NevisSt. LuciaSt. Vincent and the GrenadinesSub-Saharan Africa Sub-Saharan Africa (excluding high income)Sub-Saharan Africa (IDA & IBRD countries)SudanSurinameSwazilandSwedenSwitzerlandSyrian Arab RepublicTajikistanTanzaniaThailandTimor-LesteTogoTongaTrinidad and TobagoTunisiaTurkeyTurkmenistanTuvaluUgandaUkraineUnited Arab EmiratesUnited KingdomUnited StatesUpper middle incomeUruguayUzbekistanVanuatuVenezuela, RBVietnamWest Bank and GazaWorldYemen, Rep.ZambiaZimbabwe Timeline:
This timeline shows a graph from 1971 to 2015 of Latin America & Caribbean (excluding high income). No data until 1970. Number of actual observations by date: 45.
Source name:
World Development Indicators
Source organization:
UNESCO Institute for Statistics
Categories, topics:
Education
Last updated:
apr 23, 2017
Indicators value changes by year
Minimum:
25.803
jan 1, 1971
Maximum:
94.022
jan 1, 2015
At the date of observation
Value
Absolute change
Change from previous value
jan 1, 1971
25.803
+25.803
0.0%
jan 1, 1972
27.014
+1.211
4.69%
jan 1, 1973
30.157
+3.143
11.63%
jan 1, 1974
32.394
+2.237
7.42%
jan 1, 1975
37.833
+5.44
16.79%
jan 1, 1976
39.849
+2.015
5.33%
jan 1, 1977
42.841
+2.992
7.51%
jan 1, 1978
45.448
+2.607
6.09%
jan 1, 1979
46.819
+1.371
3.02%
jan 1, 1980
70.988
+24.169
51.62%
jan 1, 1981
71.916
+0.928
1.31%
jan 1, 1982
72.617
+0.702
0.98%
jan 1, 1983
73.602
+0.984
1.36%
jan 1, 1984
74.19
+0.588
0.8%
jan 1, 1985
74.976
+0.786
1.06%
jan 1, 1986
52.082
-22.894
-30.54%
jan 1, 1987
75.895
+23.813
45.72%
jan 1, 1988
75.967
+0.073
0.1%
jan 1, 1989
76.039
+0.072
0.09%
jan 1, 1990
76.057
+0.018
0.02%
jan 1, 1991
75.959
-0.098
-0.13%
jan 1, 1992
75.934
-0.025
-0.03%
jan 1, 1993
76.542
+0.608
0.8%
jan 1, 1994
76.943
+0.402
0.53%
jan 1, 1995
77.589
+0.645
0.84%
jan 1, 1996
78.597
+1.008
1.3%
jan 1, 1997
80.002
+1.405
1.79%
jan 1, 1998
80.719
+0.717
0.9%
jan 1, 1999
82.582
+1.863
2.31%
jan 1, 2000
83.623
+1.041
1.26%
jan 1, 2001
85.205
+1.582
1.89%
jan 1, 2002
85.938
+0.733
0.86%
jan 1, 2003
87.163
+1.226
1.43%
jan 1, 2004
84.909
-2.255
-2.59%
jan 1, 2005
86.156
+1.248
1.47%
jan 1, 2006
86.522
+0.366
0.42%
jan 1, 2007
86.478
-0.044
-0.05%
jan 1, 2008
86.217
-0.261
-0.3%
jan 1, 2009
87.553
+1.336
1.55%
jan 1, 2010
88.403
+0.85
0.97%
jan 1, 2011
89.75
+1.347
1.52%
jan 1, 2012
89.216
-0.534
-0.6%
jan 1, 2013
89.65
+0.434
0.49%
jan 1, 2014
93.419
+3.769
4.2%
jan 1, 2015
94.022
+0.603
0.65%
Ranking of countries by current statistics by years


Comments: