29
/
en
AIzaSyAYiBZKx7MnpbEhh9jyipgxe19OcubqV5w
April 1, 2024
250826
St. Lucia
LCA
true
2
1
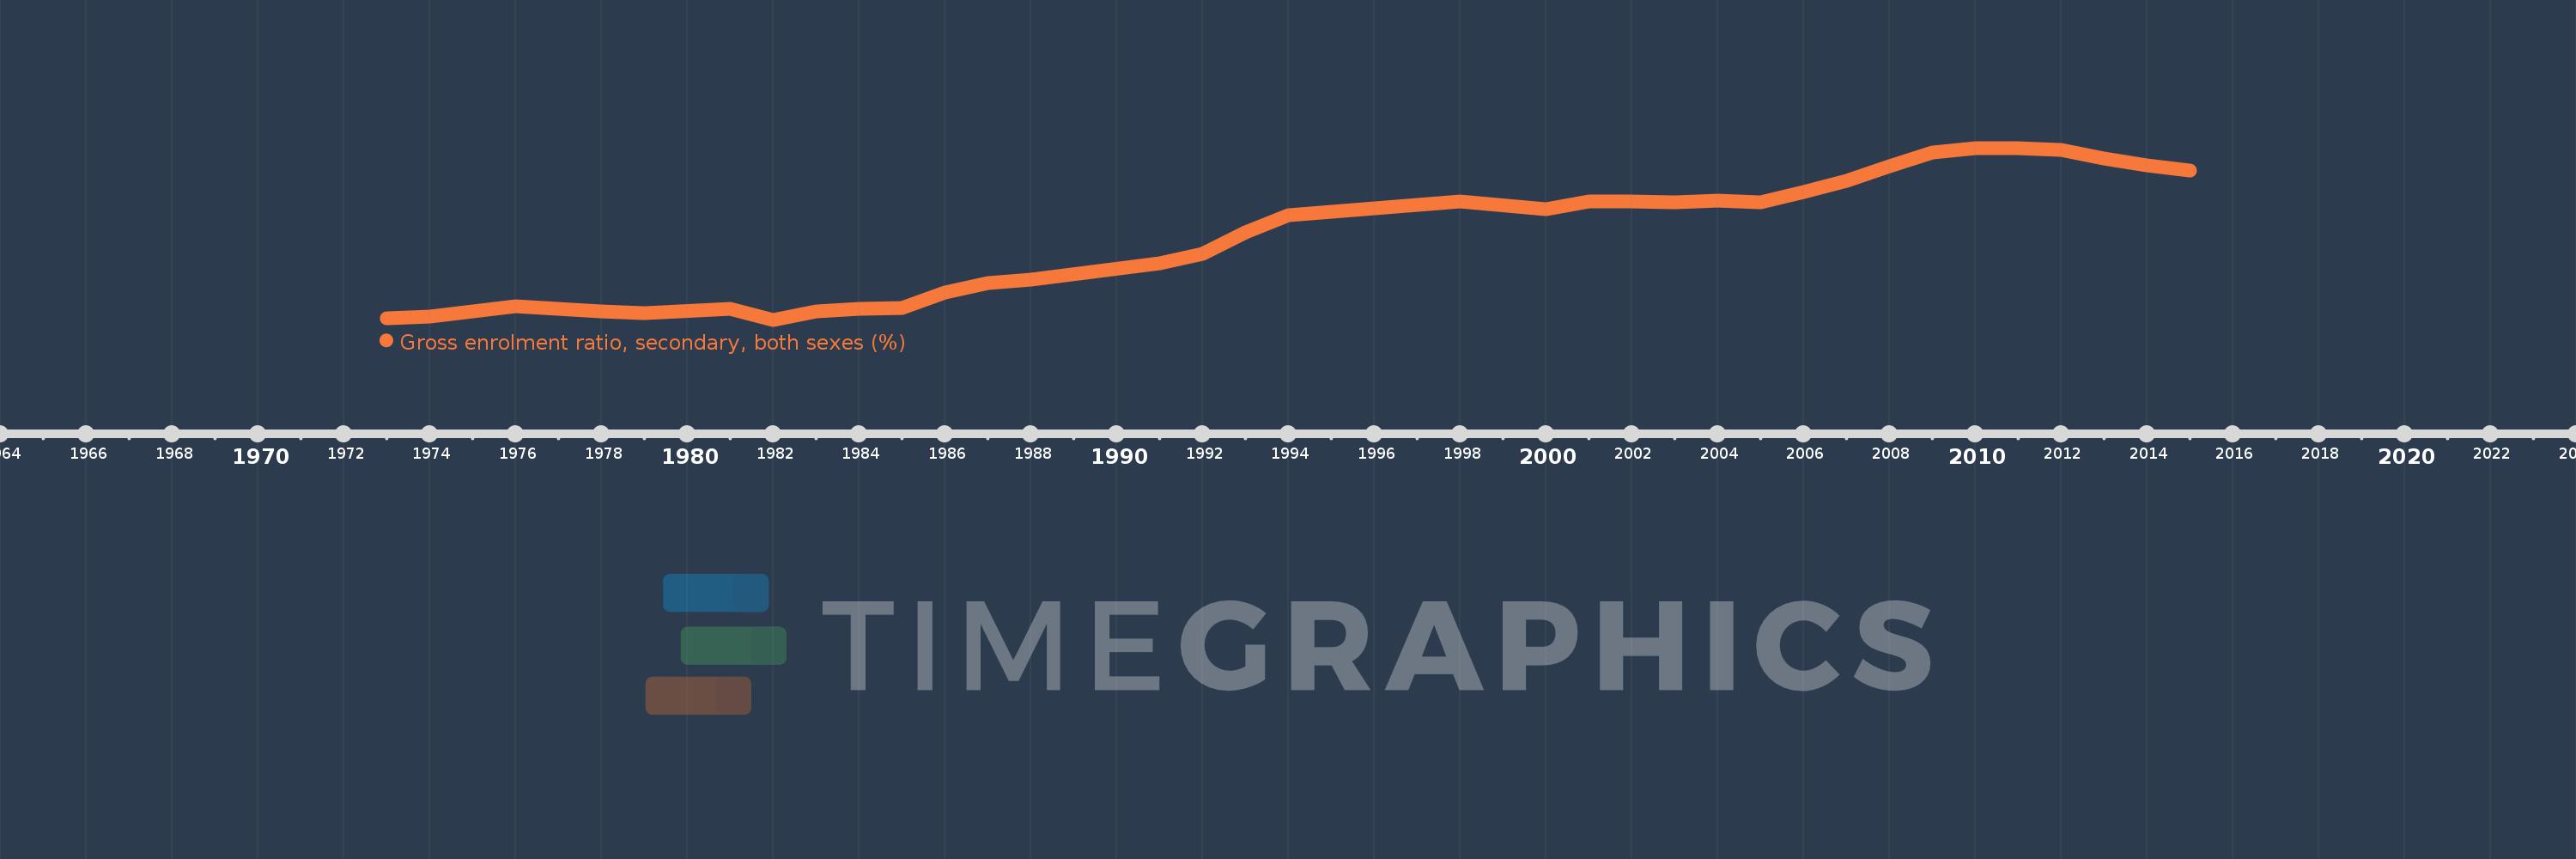
Gross enrolment ratio, secondary, both sexes (%)
2015,2014,2013,2012,2011,2010,2009,2008,2007,2006,2005,2004,2003,2002,2001,2000,1998,1994,1993,1992,1991,1988,1987,1986,1985,1984,1983,1982,1981,1979,1978,1977,1976,1975,1974,1973
This statistics in other country:
AfghanistanAlbaniaAlgeriaAndorraAngolaAntigua and BarbudaArab WorldArgentinaArmeniaArubaAustraliaAustriaAzerbaijanBahamas, TheBahrainBangladeshBarbadosBelarusBelgiumBelizeBeninBermudaBhutanBoliviaBosnia and HerzegovinaBotswanaBrazilBritish Virgin IslandsBrunei DarussalamBulgariaBurkina FasoBurundiCabo VerdeCambodiaCameroonCanadaCaribbean small statesCentral African RepublicCentral Europe and the BalticsChadChileChinaColombiaComorosCongo, Dem. Rep.Congo, Rep.Costa RicaCote d'IvoireCroatiaCubaCuracaoCyprusCzech RepublicDenmarkDjiboutiDominicaDominican RepublicEarly-demographic dividendEast Asia & PacificEast Asia & Pacific (excluding high income)East Asia & Pacific (IDA & IBRD countries)EcuadorEgypt, Arab Rep.El SalvadorEquatorial GuineaEritreaEstoniaEthiopiaEuro areaEurope & Central AsiaEurope & Central Asia (excluding high income)Europe & Central Asia (IDA & IBRD countries)European UnionFijiFinlandFragile and conflict affected situationsFranceGabonGambia, TheGeorgiaGermanyGhanaGreeceGrenadaGuatemalaGuineaGuinea-BissauGuyanaHaitiHeavily indebted poor countries (HIPC)High incomeHondurasHong Kong SAR, ChinaHungaryIBRD onlyIcelandIDA & IBRD totalIDA blendIDA onlyIDA totalIndiaIndonesiaIran, Islamic Rep.IraqIrelandIsraelItalyJamaicaJapanJordanKazakhstanKenyaKiribatiKorea, Dem. People’s Rep.Korea, Rep.KuwaitKyrgyz RepublicLao PDRLate-demographic dividendLatin America & Caribbean Latin America & Caribbean (excluding high income)Latin America & the Caribbean (IDA & IBRD countries)LatviaLeast developed countries: UN classificationLebanonLesothoLiberiaLibyaLiechtensteinLithuaniaLow & middle incomeLow incomeLower middle incomeLuxembourgMacao SAR, ChinaMacedonia, FYRMadagascarMalawiMalaysiaMaldivesMaliMaltaMarshall IslandsMauritaniaMauritiusMexicoMicronesia, Fed. Sts.Middle East & North AfricaMiddle East & North Africa (excluding high income)Middle East & North Africa (IDA & IBRD countries)Middle incomeMoldovaMongoliaMontenegroMoroccoMozambiqueMyanmarNamibiaNauruNepalNetherlandsNew ZealandNicaraguaNigerNigeriaNorth AmericaNorwayOECD membersOmanOther small statesPacific island small statesPakistanPalauPanamaPapua New GuineaParaguayPeruPhilippinesPolandPortugalPost-demographic dividendPre-demographic dividendPuerto RicoQatarRomaniaRussian FederationRwandaSamoaSan MarinoSao Tome and PrincipeSaudi ArabiaSenegalSerbiaSeychellesSierra LeoneSlovak RepublicSloveniaSmall statesSolomon IslandsSomaliaSouth AfricaSouth AsiaSouth Asia (IDA & IBRD)SpainSri LankaSt. Kitts and NevisSt. LuciaSt. Vincent and the GrenadinesSub-Saharan Africa Sub-Saharan Africa (excluding high income)Sub-Saharan Africa (IDA & IBRD countries)SudanSurinameSwazilandSwedenSwitzerlandSyrian Arab RepublicTajikistanTanzaniaThailandTimor-LesteTogoTongaTrinidad and TobagoTunisiaTurkeyTurkmenistanTuvaluUgandaUkraineUnited Arab EmiratesUnited KingdomUnited StatesUpper middle incomeUruguayUzbekistanVanuatuVenezuela, RBVietnamWest Bank and GazaWorldYemen, Rep.ZambiaZimbabwe Timeline:
This timeline shows a graph from 1973 to 2015 of St. Lucia. No data until 1972. Number of actual observations by date: 36.
Source name:
World Development Indicators
Source organization:
UNESCO Institute for Statistics
Categories, topics:
Education
Last updated:
apr 23, 2017
Indicators value changes by year
Minimum:
27.057
jan 1, 1982
Maximum:
95.455
jan 1, 2010
At the date of observation
Value
Absolute change
Change from previous value
jan 1, 1973
27.759
+27.759
0.0%
jan 1, 1974
28.19
+0.432
1.56%
jan 1, 1975
30.338
+2.148
7.62%
jan 1, 1976
32.438
+2.1
6.92%
jan 1, 1977
31.351
-1.088
-3.35%
jan 1, 1978
30.393
-0.957
-3.05%
jan 1, 1979
29.728
-0.665
-2.19%
jan 1, 1981
31.297
+1.569
5.28%
jan 1, 1982
27.057
-4.24
-13.55%
jan 1, 1983
30.402
+3.345
12.36%
jan 1, 1984
31.53
+1.128
3.71%
jan 1, 1985
31.79
+0.26
0.82%
jan 1, 1986
37.996
+6.206
19.52%
jan 1, 1987
41.667
+3.671
9.66%
jan 1, 1988
42.896
+1.228
2.95%
jan 1, 1991
49.377
+6.481
15.11%
jan 1, 1992
53.348
+3.971
8.04%
jan 1, 1993
61.951
+8.603
16.13%
jan 1, 1994
68.797
+6.846
11.05%
jan 1, 1998
74.086
+5.289
7.69%
jan 1, 2000
71.187
-2.899
-3.91%
jan 1, 2001
73.984
+2.797
3.93%
jan 1, 2002
74.239
+0.255
0.34%
jan 1, 2003
73.638
-0.602
-0.81%
jan 1, 2004
74.604
+0.966
1.31%
jan 1, 2005
73.74
-0.863
-1.16%
jan 1, 2006
77.764
+4.024
5.46%
jan 1, 2007
82.31
+4.546
5.85%
jan 1, 2008
88.043
+5.733
6.97%
jan 1, 2009
93.715
+5.672
6.44%
jan 1, 2010
95.455
+1.74
1.86%
jan 1, 2011
95.209
-0.246
-0.26%
jan 1, 2012
94.64
-0.569
-0.6%
jan 1, 2013
91.107
-3.533
-3.73%
jan 1, 2014
88.385
-2.721
-2.99%
jan 1, 2015
86.457
-1.928
-2.18%
Ranking of countries by current statistics by years


Comments: