29
/
en
AIzaSyAYiBZKx7MnpbEhh9jyipgxe19OcubqV5w
April 1, 2024
51892
North America
NAC
false
2
1
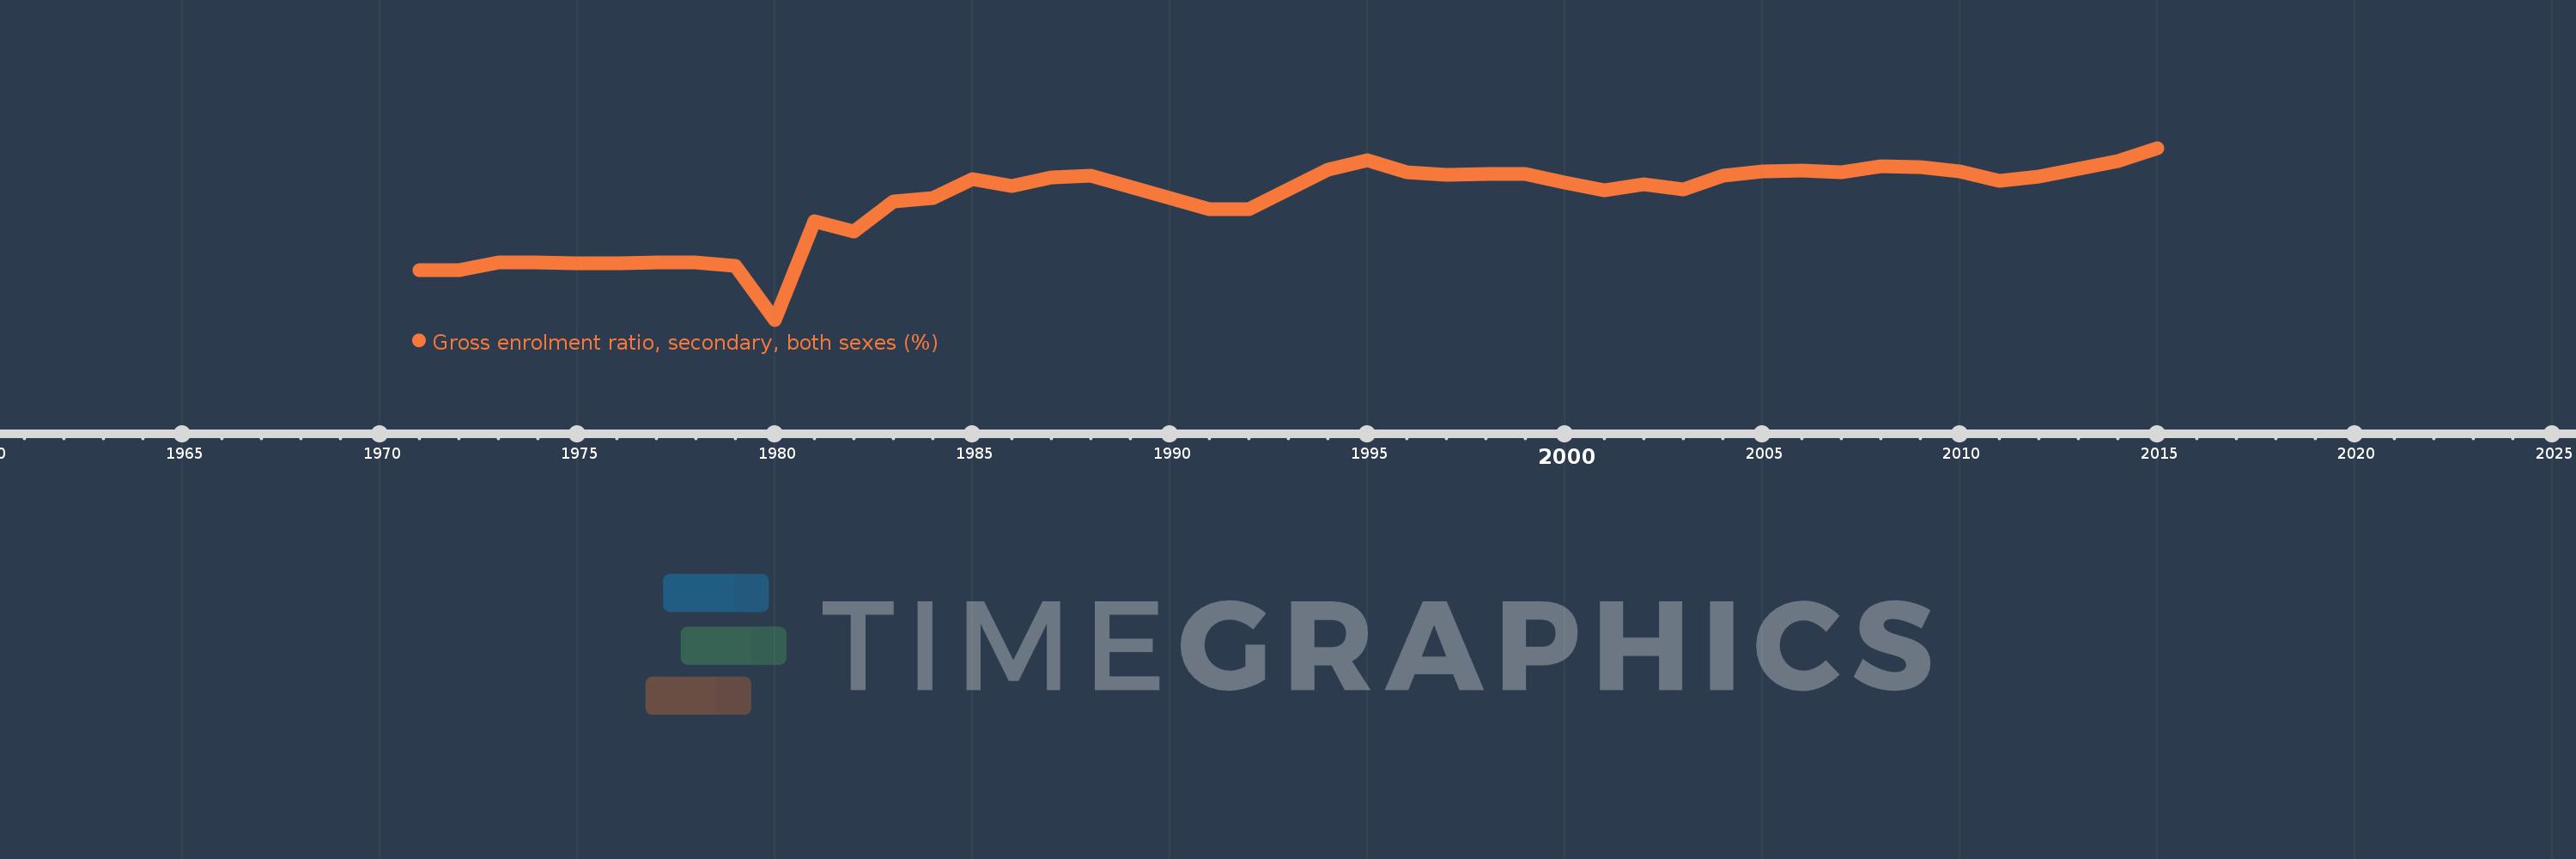
Gross enrolment ratio, secondary, both sexes (%)
2015,2014,2013,2012,2011,2010,2009,2008,2007,2006,2005,2004,2003,2002,2001,2000,1999,1998,1997,1996,1995,1994,1993,1992,1991,1990,1989,1988,1987,1986,1985,1984,1983,1982,1981,1980,1979,1978,1977,1976,1975,1974,1973,1972,1971
This statistics in other country:
AfghanistanAlbaniaAlgeriaAndorraAngolaAntigua and BarbudaArab WorldArgentinaArmeniaArubaAustraliaAustriaAzerbaijanBahamas, TheBahrainBangladeshBarbadosBelarusBelgiumBelizeBeninBermudaBhutanBoliviaBosnia and HerzegovinaBotswanaBrazilBritish Virgin IslandsBrunei DarussalamBulgariaBurkina FasoBurundiCabo VerdeCambodiaCameroonCanadaCaribbean small statesCentral African RepublicCentral Europe and the BalticsChadChileChinaColombiaComorosCongo, Dem. Rep.Congo, Rep.Costa RicaCote d'IvoireCroatiaCubaCuracaoCyprusCzech RepublicDenmarkDjiboutiDominicaDominican RepublicEarly-demographic dividendEast Asia & PacificEast Asia & Pacific (excluding high income)East Asia & Pacific (IDA & IBRD countries)EcuadorEgypt, Arab Rep.El SalvadorEquatorial GuineaEritreaEstoniaEthiopiaEuro areaEurope & Central AsiaEurope & Central Asia (excluding high income)Europe & Central Asia (IDA & IBRD countries)European UnionFijiFinlandFragile and conflict affected situationsFranceGabonGambia, TheGeorgiaGermanyGhanaGreeceGrenadaGuatemalaGuineaGuinea-BissauGuyanaHaitiHeavily indebted poor countries (HIPC)High incomeHondurasHong Kong SAR, ChinaHungaryIBRD onlyIcelandIDA & IBRD totalIDA blendIDA onlyIDA totalIndiaIndonesiaIran, Islamic Rep.IraqIrelandIsraelItalyJamaicaJapanJordanKazakhstanKenyaKiribatiKorea, Dem. People’s Rep.Korea, Rep.KuwaitKyrgyz RepublicLao PDRLate-demographic dividendLatin America & Caribbean Latin America & Caribbean (excluding high income)Latin America & the Caribbean (IDA & IBRD countries)LatviaLeast developed countries: UN classificationLebanonLesothoLiberiaLibyaLiechtensteinLithuaniaLow & middle incomeLow incomeLower middle incomeLuxembourgMacao SAR, ChinaMacedonia, FYRMadagascarMalawiMalaysiaMaldivesMaliMaltaMarshall IslandsMauritaniaMauritiusMexicoMicronesia, Fed. Sts.Middle East & North AfricaMiddle East & North Africa (excluding high income)Middle East & North Africa (IDA & IBRD countries)Middle incomeMoldovaMongoliaMontenegroMoroccoMozambiqueMyanmarNamibiaNauruNepalNetherlandsNew ZealandNicaraguaNigerNigeriaNorth AmericaNorwayOECD membersOmanOther small statesPacific island small statesPakistanPalauPanamaPapua New GuineaParaguayPeruPhilippinesPolandPortugalPost-demographic dividendPre-demographic dividendPuerto RicoQatarRomaniaRussian FederationRwandaSamoaSan MarinoSao Tome and PrincipeSaudi ArabiaSenegalSerbiaSeychellesSierra LeoneSlovak RepublicSloveniaSmall statesSolomon IslandsSomaliaSouth AfricaSouth AsiaSouth Asia (IDA & IBRD)SpainSri LankaSt. Kitts and NevisSt. LuciaSt. Vincent and the GrenadinesSub-Saharan Africa Sub-Saharan Africa (excluding high income)Sub-Saharan Africa (IDA & IBRD countries)SudanSurinameSwazilandSwedenSwitzerlandSyrian Arab RepublicTajikistanTanzaniaThailandTimor-LesteTogoTongaTrinidad and TobagoTunisiaTurkeyTurkmenistanTuvaluUgandaUkraineUnited Arab EmiratesUnited KingdomUnited StatesUpper middle incomeUruguayUzbekistanVanuatuVenezuela, RBVietnamWest Bank and GazaWorldYemen, Rep.ZambiaZimbabwe Timeline:
This timeline shows a graph from 1971 to 2015 of North America. No data until 1970. Number of actual observations by date: 45.
Source name:
World Development Indicators
Source organization:
UNESCO Institute for Statistics
Categories, topics:
Education
Last updated:
apr 23, 2017
Indicators value changes by year
Minimum:
79.528
jan 1, 1980
Maximum:
98.658
jan 1, 2015
At the date of observation
Value
Absolute change
Change from previous value
jan 1, 1971
85.013
+85.013
0.0%
jan 1, 1972
85.018
+0.006
0.01%
jan 1, 1973
85.885
+0.866
1.02%
jan 1, 1974
85.887
+0.003
0.0%
jan 1, 1975
85.832
-0.055
-0.06%
jan 1, 1976
85.813
-0.019
-0.02%
jan 1, 1977
85.876
+0.063
0.07%
jan 1, 1978
85.879
+0.004
0.0%
jan 1, 1979
85.503
-0.376
-0.44%
jan 1, 1980
79.528
-5.975
-6.99%
jan 1, 1981
90.471
+10.943
13.76%
jan 1, 1982
89.377
-1.095
-1.21%
jan 1, 1983
92.678
+3.302
3.69%
jan 1, 1984
93.086
+0.408
0.44%
jan 1, 1985
95.18
+2.095
2.25%
jan 1, 1986
94.409
-0.771
-0.81%
jan 1, 1987
95.4
+0.991
1.05%
jan 1, 1988
95.571
+0.171
0.18%
jan 1, 1989
94.32
-1.251
-1.31%
jan 1, 1990
93.069
-1.251
-1.33%
jan 1, 1991
91.809
-1.26
-1.35%
jan 1, 1992
91.848
+0.038
0.04%
jan 1, 1993
93.998
+2.151
2.34%
jan 1, 1994
96.203
+2.205
2.35%
jan 1, 1995
97.316
+1.112
1.16%
jan 1, 1996
95.974
-1.342
-1.38%
jan 1, 1997
95.696
-0.278
-0.29%
jan 1, 1998
95.747
+0.051
0.05%
jan 1, 1999
95.796
+0.049
0.05%
jan 1, 2000
94.781
-1.015
-1.06%
jan 1, 2001
93.944
-0.837
-0.88%
jan 1, 2002
94.636
+0.692
0.74%
jan 1, 2003
94.023
-0.613
-0.65%
jan 1, 2004
95.573
+1.551
1.65%
jan 1, 2005
96.017
+0.443
0.46%
jan 1, 2006
96.163
+0.147
0.15%
jan 1, 2007
95.952
-0.211
-0.22%
jan 1, 2008
96.587
+0.635
0.66%
jan 1, 2009
96.545
-0.042
-0.04%
jan 1, 2010
96.078
-0.467
-0.48%
jan 1, 2011
95.039
-1.038
-1.08%
jan 1, 2012
95.45
+0.41
0.43%
jan 1, 2013
96.336
+0.886
0.93%
jan 1, 2014
97.171
+0.835
0.87%
jan 1, 2015
98.658
+1.487
1.53%
Ranking of countries by current statistics by years


Comments: