29
/
en
AIzaSyAYiBZKx7MnpbEhh9jyipgxe19OcubqV5w
April 1, 2024
160545
Israel
ISR
true
2
1
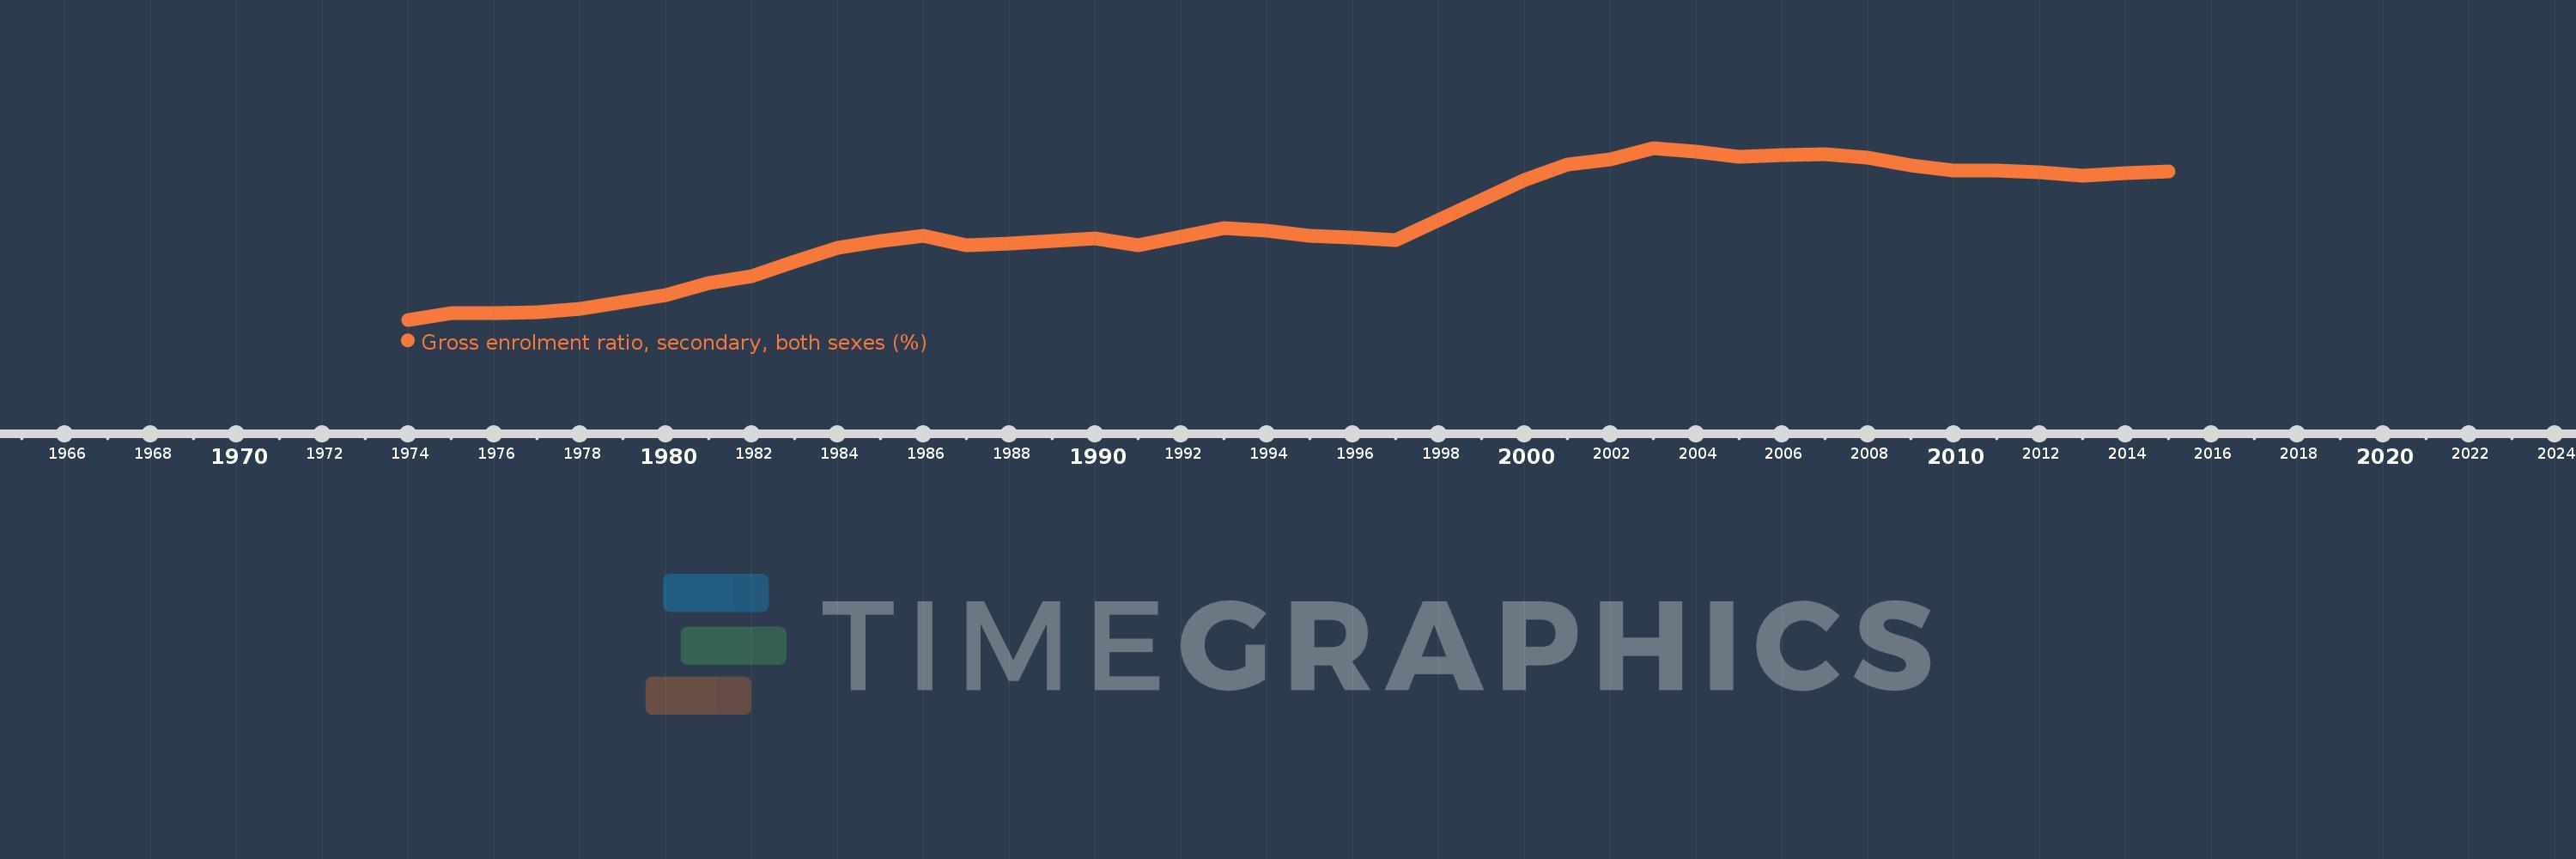
Gross enrolment ratio, secondary, both sexes (%)
2015,2014,2013,2012,2011,2010,2009,2008,2007,2006,2005,2004,2003,2002,2001,2000,1997,1996,1995,1994,1993,1992,1991,1990,1989,1988,1987,1986,1985,1984,1983,1982,1981,1980,1979,1978,1977,1976,1975,1974
This statistics in other country:
AfghanistanAlbaniaAlgeriaAndorraAngolaAntigua and BarbudaArab WorldArgentinaArmeniaArubaAustraliaAustriaAzerbaijanBahamas, TheBahrainBangladeshBarbadosBelarusBelgiumBelizeBeninBermudaBhutanBoliviaBosnia and HerzegovinaBotswanaBrazilBritish Virgin IslandsBrunei DarussalamBulgariaBurkina FasoBurundiCabo VerdeCambodiaCameroonCanadaCaribbean small statesCentral African RepublicCentral Europe and the BalticsChadChileChinaColombiaComorosCongo, Dem. Rep.Congo, Rep.Costa RicaCote d'IvoireCroatiaCubaCuracaoCyprusCzech RepublicDenmarkDjiboutiDominicaDominican RepublicEarly-demographic dividendEast Asia & PacificEast Asia & Pacific (excluding high income)East Asia & Pacific (IDA & IBRD countries)EcuadorEgypt, Arab Rep.El SalvadorEquatorial GuineaEritreaEstoniaEthiopiaEuro areaEurope & Central AsiaEurope & Central Asia (excluding high income)Europe & Central Asia (IDA & IBRD countries)European UnionFijiFinlandFragile and conflict affected situationsFranceGabonGambia, TheGeorgiaGermanyGhanaGreeceGrenadaGuatemalaGuineaGuinea-BissauGuyanaHaitiHeavily indebted poor countries (HIPC)High incomeHondurasHong Kong SAR, ChinaHungaryIBRD onlyIcelandIDA & IBRD totalIDA blendIDA onlyIDA totalIndiaIndonesiaIran, Islamic Rep.IraqIrelandIsraelItalyJamaicaJapanJordanKazakhstanKenyaKiribatiKorea, Dem. People’s Rep.Korea, Rep.KuwaitKyrgyz RepublicLao PDRLate-demographic dividendLatin America & Caribbean Latin America & Caribbean (excluding high income)Latin America & the Caribbean (IDA & IBRD countries)LatviaLeast developed countries: UN classificationLebanonLesothoLiberiaLibyaLiechtensteinLithuaniaLow & middle incomeLow incomeLower middle incomeLuxembourgMacao SAR, ChinaMacedonia, FYRMadagascarMalawiMalaysiaMaldivesMaliMaltaMarshall IslandsMauritaniaMauritiusMexicoMicronesia, Fed. Sts.Middle East & North AfricaMiddle East & North Africa (excluding high income)Middle East & North Africa (IDA & IBRD countries)Middle incomeMoldovaMongoliaMontenegroMoroccoMozambiqueMyanmarNamibiaNauruNepalNetherlandsNew ZealandNicaraguaNigerNigeriaNorth AmericaNorwayOECD membersOmanOther small statesPacific island small statesPakistanPalauPanamaPapua New GuineaParaguayPeruPhilippinesPolandPortugalPost-demographic dividendPre-demographic dividendPuerto RicoQatarRomaniaRussian FederationRwandaSamoaSan MarinoSao Tome and PrincipeSaudi ArabiaSenegalSerbiaSeychellesSierra LeoneSlovak RepublicSloveniaSmall statesSolomon IslandsSomaliaSouth AfricaSouth AsiaSouth Asia (IDA & IBRD)SpainSri LankaSt. Kitts and NevisSt. LuciaSt. Vincent and the GrenadinesSub-Saharan Africa Sub-Saharan Africa (excluding high income)Sub-Saharan Africa (IDA & IBRD countries)SudanSurinameSwazilandSwedenSwitzerlandSyrian Arab RepublicTajikistanTanzaniaThailandTimor-LesteTogoTongaTrinidad and TobagoTunisiaTurkeyTurkmenistanTuvaluUgandaUkraineUnited Arab EmiratesUnited KingdomUnited StatesUpper middle incomeUruguayUzbekistanVanuatuVenezuela, RBVietnamWest Bank and GazaWorldYemen, Rep.ZambiaZimbabwe Timeline:
This timeline shows a graph from 1974 to 2015 of Israel. No data until 1973. Number of actual observations by date: 40.
Source name:
World Development Indicators
Source organization:
UNESCO Institute for Statistics
Categories, topics:
Education
Last updated:
apr 23, 2017
Indicators value changes by year
Minimum:
75.424
jan 1, 1974
Maximum:
106.03
jan 1, 2003
At the date of observation
Value
Absolute change
Change from previous value
jan 1, 1974
75.424
+75.424
0.0%
jan 1, 1975
76.581
+1.157
1.53%
jan 1, 1976
76.591
+0.01
0.01%
jan 1, 1977
76.697
+0.106
0.14%
jan 1, 1978
77.344
+0.647
0.84%
jan 1, 1979
78.649
+1.305
1.69%
jan 1, 1980
79.891
+1.242
1.58%
jan 1, 1981
81.886
+1.995
2.5%
jan 1, 1982
83.245
+1.359
1.66%
jan 1, 1983
85.773
+2.528
3.04%
jan 1, 1984
88.157
+2.384
2.78%
jan 1, 1985
89.515
+1.358
1.54%
jan 1, 1986
90.406
+0.891
1.0%
jan 1, 1987
88.692
-1.714
-1.9%
jan 1, 1988
89.022
+0.33
0.37%
jan 1, 1989
89.427
+0.405
0.45%
jan 1, 1990
89.924
+0.498
0.56%
jan 1, 1991
88.731
-1.193
-1.33%
jan 1, 1992
90.225
+1.494
1.68%
jan 1, 1993
91.785
+1.56
1.73%
jan 1, 1994
91.217
-0.568
-0.62%
jan 1, 1995
90.355
-0.862
-0.95%
jan 1, 1996
90.006
-0.349
-0.39%
jan 1, 1997
89.541
-0.465
-0.52%
jan 1, 2000
100.299
+10.758
12.01%
jan 1, 2001
103.003
+2.704
2.7%
jan 1, 2002
103.963
+0.959
0.93%
jan 1, 2003
106.03
+2.068
1.99%
jan 1, 2004
105.423
-0.607
-0.57%
jan 1, 2005
104.507
-0.917
-0.87%
jan 1, 2006
104.736
+0.229
0.22%
jan 1, 2007
104.888
+0.151
0.14%
jan 1, 2008
104.269
-0.619
-0.59%
jan 1, 2009
102.882
-1.387
-1.33%
jan 1, 2010
101.992
-0.89
-0.87%
jan 1, 2011
102.056
+0.064
0.06%
jan 1, 2012
101.698
-0.358
-0.35%
jan 1, 2013
101.064
-0.634
-0.62%
jan 1, 2014
101.532
+0.468
0.46%
jan 1, 2015
101.864
+0.332
0.33%
Ranking of countries by current statistics by years


Comments: