29
/
en
AIzaSyAYiBZKx7MnpbEhh9jyipgxe19OcubqV5w
April 1, 2024
277730
Uruguay
URY
true
2
1
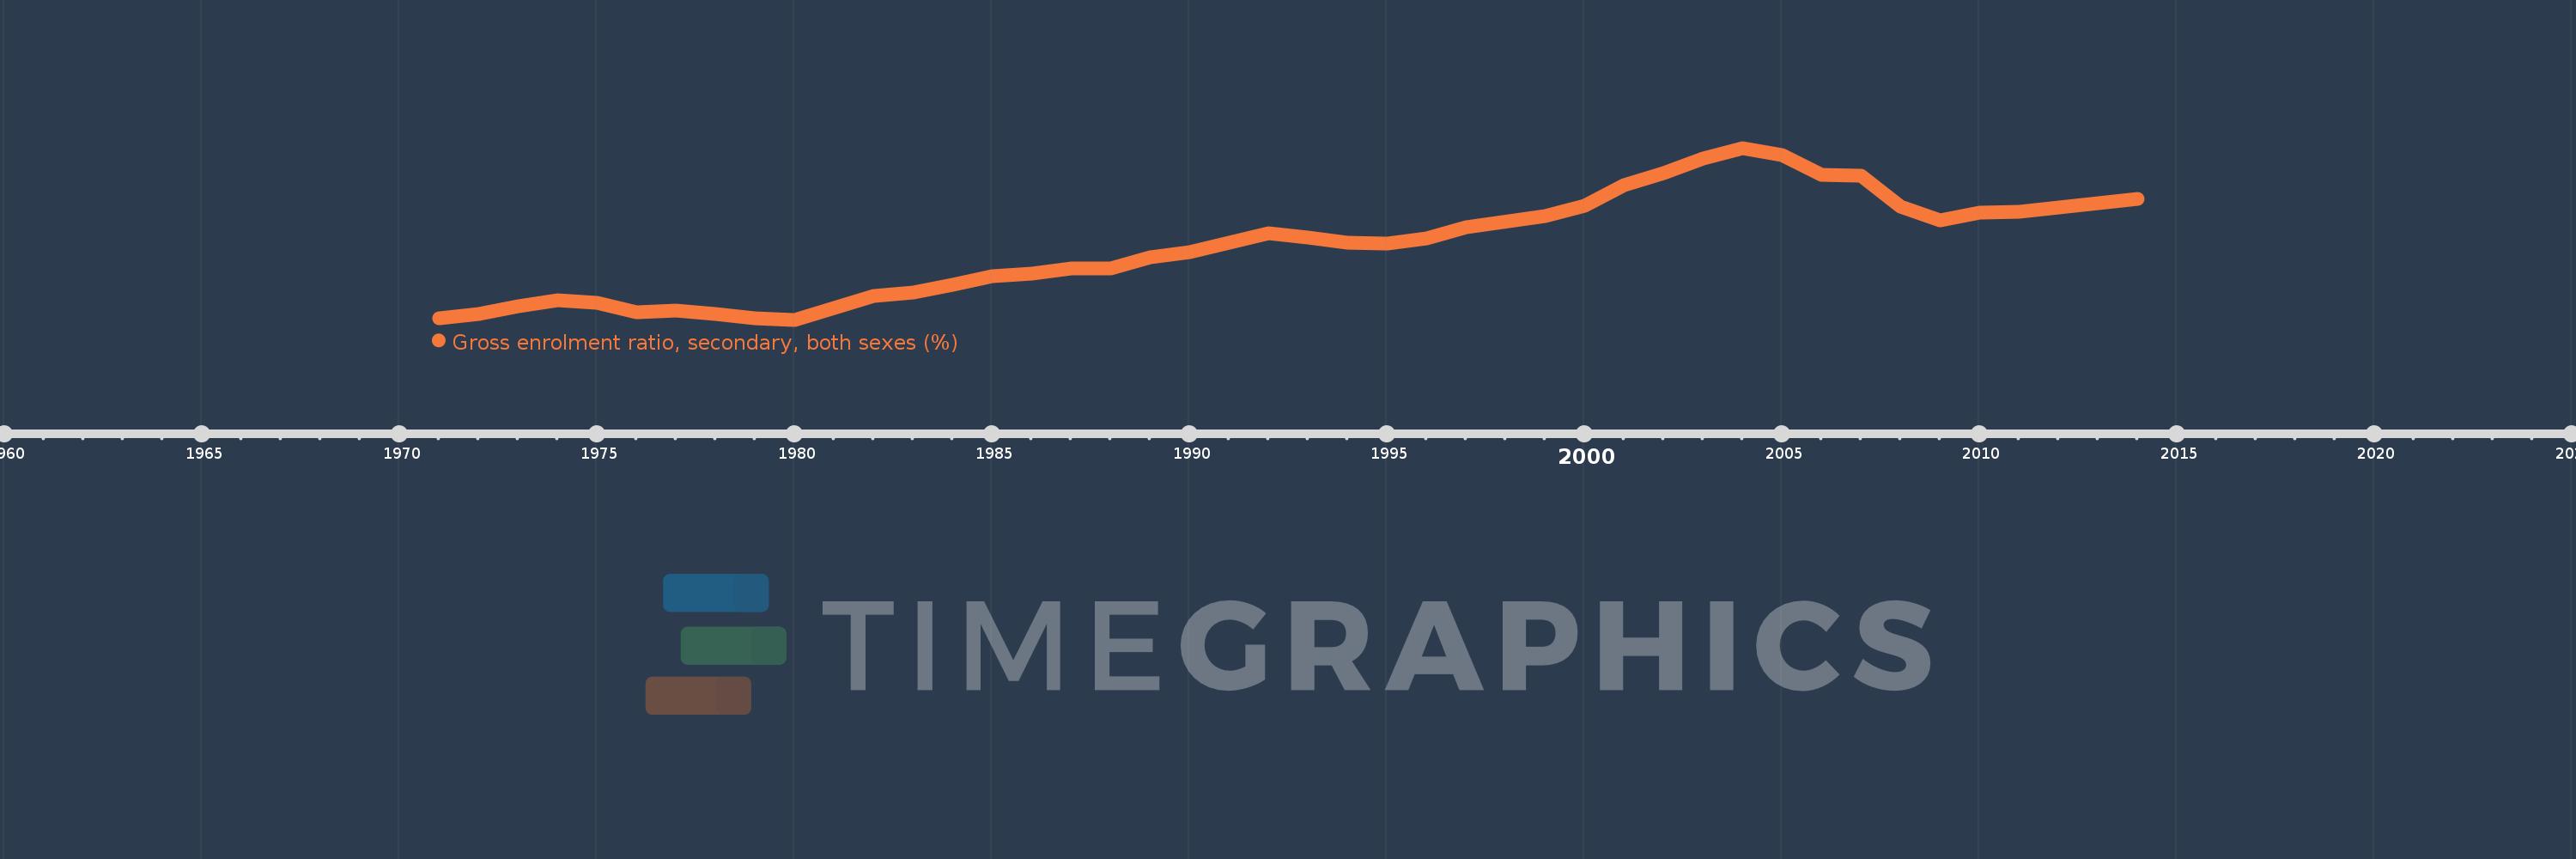
Gross enrolment ratio, secondary, both sexes (%)
2014,2011,2010,2009,2008,2007,2006,2005,2004,2003,2002,2001,2000,1999,1997,1996,1995,1994,1993,1992,1991,1990,1989,1988,1987,1986,1985,1984,1983,1982,1980,1979,1978,1977,1976,1975,1974,1973,1972,1971
This statistics in other country:
AfghanistanAlbaniaAlgeriaAndorraAngolaAntigua and BarbudaArab WorldArgentinaArmeniaArubaAustraliaAustriaAzerbaijanBahamas, TheBahrainBangladeshBarbadosBelarusBelgiumBelizeBeninBermudaBhutanBoliviaBosnia and HerzegovinaBotswanaBrazilBritish Virgin IslandsBrunei DarussalamBulgariaBurkina FasoBurundiCabo VerdeCambodiaCameroonCanadaCaribbean small statesCentral African RepublicCentral Europe and the BalticsChadChileChinaColombiaComorosCongo, Dem. Rep.Congo, Rep.Costa RicaCote d'IvoireCroatiaCubaCuracaoCyprusCzech RepublicDenmarkDjiboutiDominicaDominican RepublicEarly-demographic dividendEast Asia & PacificEast Asia & Pacific (excluding high income)East Asia & Pacific (IDA & IBRD countries)EcuadorEgypt, Arab Rep.El SalvadorEquatorial GuineaEritreaEstoniaEthiopiaEuro areaEurope & Central AsiaEurope & Central Asia (excluding high income)Europe & Central Asia (IDA & IBRD countries)European UnionFijiFinlandFragile and conflict affected situationsFranceGabonGambia, TheGeorgiaGermanyGhanaGreeceGrenadaGuatemalaGuineaGuinea-BissauGuyanaHaitiHeavily indebted poor countries (HIPC)High incomeHondurasHong Kong SAR, ChinaHungaryIBRD onlyIcelandIDA & IBRD totalIDA blendIDA onlyIDA totalIndiaIndonesiaIran, Islamic Rep.IraqIrelandIsraelItalyJamaicaJapanJordanKazakhstanKenyaKiribatiKorea, Dem. People’s Rep.Korea, Rep.KuwaitKyrgyz RepublicLao PDRLate-demographic dividendLatin America & Caribbean Latin America & Caribbean (excluding high income)Latin America & the Caribbean (IDA & IBRD countries)LatviaLeast developed countries: UN classificationLebanonLesothoLiberiaLibyaLiechtensteinLithuaniaLow & middle incomeLow incomeLower middle incomeLuxembourgMacao SAR, ChinaMacedonia, FYRMadagascarMalawiMalaysiaMaldivesMaliMaltaMarshall IslandsMauritaniaMauritiusMexicoMicronesia, Fed. Sts.Middle East & North AfricaMiddle East & North Africa (excluding high income)Middle East & North Africa (IDA & IBRD countries)Middle incomeMoldovaMongoliaMontenegroMoroccoMozambiqueMyanmarNamibiaNauruNepalNetherlandsNew ZealandNicaraguaNigerNigeriaNorth AmericaNorwayOECD membersOmanOther small statesPacific island small statesPakistanPalauPanamaPapua New GuineaParaguayPeruPhilippinesPolandPortugalPost-demographic dividendPre-demographic dividendPuerto RicoQatarRomaniaRussian FederationRwandaSamoaSan MarinoSao Tome and PrincipeSaudi ArabiaSenegalSerbiaSeychellesSierra LeoneSlovak RepublicSloveniaSmall statesSolomon IslandsSomaliaSouth AfricaSouth AsiaSouth Asia (IDA & IBRD)SpainSri LankaSt. Kitts and NevisSt. LuciaSt. Vincent and the GrenadinesSub-Saharan Africa Sub-Saharan Africa (excluding high income)Sub-Saharan Africa (IDA & IBRD countries)SudanSurinameSwazilandSwedenSwitzerlandSyrian Arab RepublicTajikistanTanzaniaThailandTimor-LesteTogoTongaTrinidad and TobagoTunisiaTurkeyTurkmenistanTuvaluUgandaUkraineUnited Arab EmiratesUnited KingdomUnited StatesUpper middle incomeUruguayUzbekistanVanuatuVenezuela, RBVietnamWest Bank and GazaWorldYemen, Rep.ZambiaZimbabwe Timeline:
This timeline shows a graph from 1971 to 2014 of Uruguay. No data until 1970. Number of actual observations by date: 40.
Source name:
World Development Indicators
Source organization:
UNESCO Institute for Statistics
Categories, topics:
Education
Last updated:
apr 23, 2017
Indicators value changes by year
Minimum:
58.385
jan 1, 1980
Maximum:
109.131
jan 1, 2004
At the date of observation
Value
Absolute change
Change from previous value
jan 1, 1971
58.77
+58.77
0.0%
jan 1, 1972
60.006
+1.236
2.1%
jan 1, 1973
62.322
+2.316
3.86%
jan 1, 1974
64.024
+1.702
2.73%
jan 1, 1975
63.436
-0.589
-0.92%
jan 1, 1976
60.548
-2.888
-4.55%
jan 1, 1977
61.097
+0.549
0.91%
jan 1, 1978
60.043
-1.054
-1.73%
jan 1, 1979
58.89
-1.153
-1.92%
jan 1, 1980
58.385
-0.505
-0.86%
jan 1, 1982
65.399
+7.014
12.01%
jan 1, 1983
66.361
+0.962
1.47%
jan 1, 1984
68.746
+2.385
3.59%
jan 1, 1985
71.225
+2.479
3.61%
jan 1, 1986
71.922
+0.697
0.98%
jan 1, 1987
73.628
+1.705
2.37%
jan 1, 1988
73.646
+0.019
0.03%
jan 1, 1989
76.727
+3.08
4.18%
jan 1, 1990
78.442
+1.715
2.24%
jan 1, 1991
81.211
+2.769
3.53%
jan 1, 1992
83.822
+2.611
3.21%
jan 1, 1993
82.542
-1.279
-1.53%
jan 1, 1994
81.114
-1.428
-1.73%
jan 1, 1995
80.855
-0.26
-0.32%
jan 1, 1996
82.387
+1.532
1.89%
jan 1, 1997
85.8
+3.413
4.14%
jan 1, 1999
89.136
+3.336
3.89%
jan 1, 2000
92.103
+2.967
3.33%
jan 1, 2001
98.244
+6.142
6.67%
jan 1, 2002
101.586
+3.341
3.4%
jan 1, 2003
106.113
+4.528
4.46%
jan 1, 2004
109.131
+3.018
2.84%
jan 1, 2005
106.976
-2.155
-1.97%
jan 1, 2006
101.216
-5.76
-5.38%
jan 1, 2007
100.812
-0.403
-0.4%
jan 1, 2008
91.832
-8.98
-8.91%
jan 1, 2009
87.686
-4.146
-4.51%
jan 1, 2010
90.074
+2.388
2.72%
jan 1, 2011
90.296
+0.222
0.25%
jan 1, 2014
94.063
+3.767
4.17%
Ranking of countries by current statistics by years


Comments: