29
/
en
AIzaSyAYiBZKx7MnpbEhh9jyipgxe19OcubqV5w
April 1, 2024
39026
IDA only
IDX
false
2
1
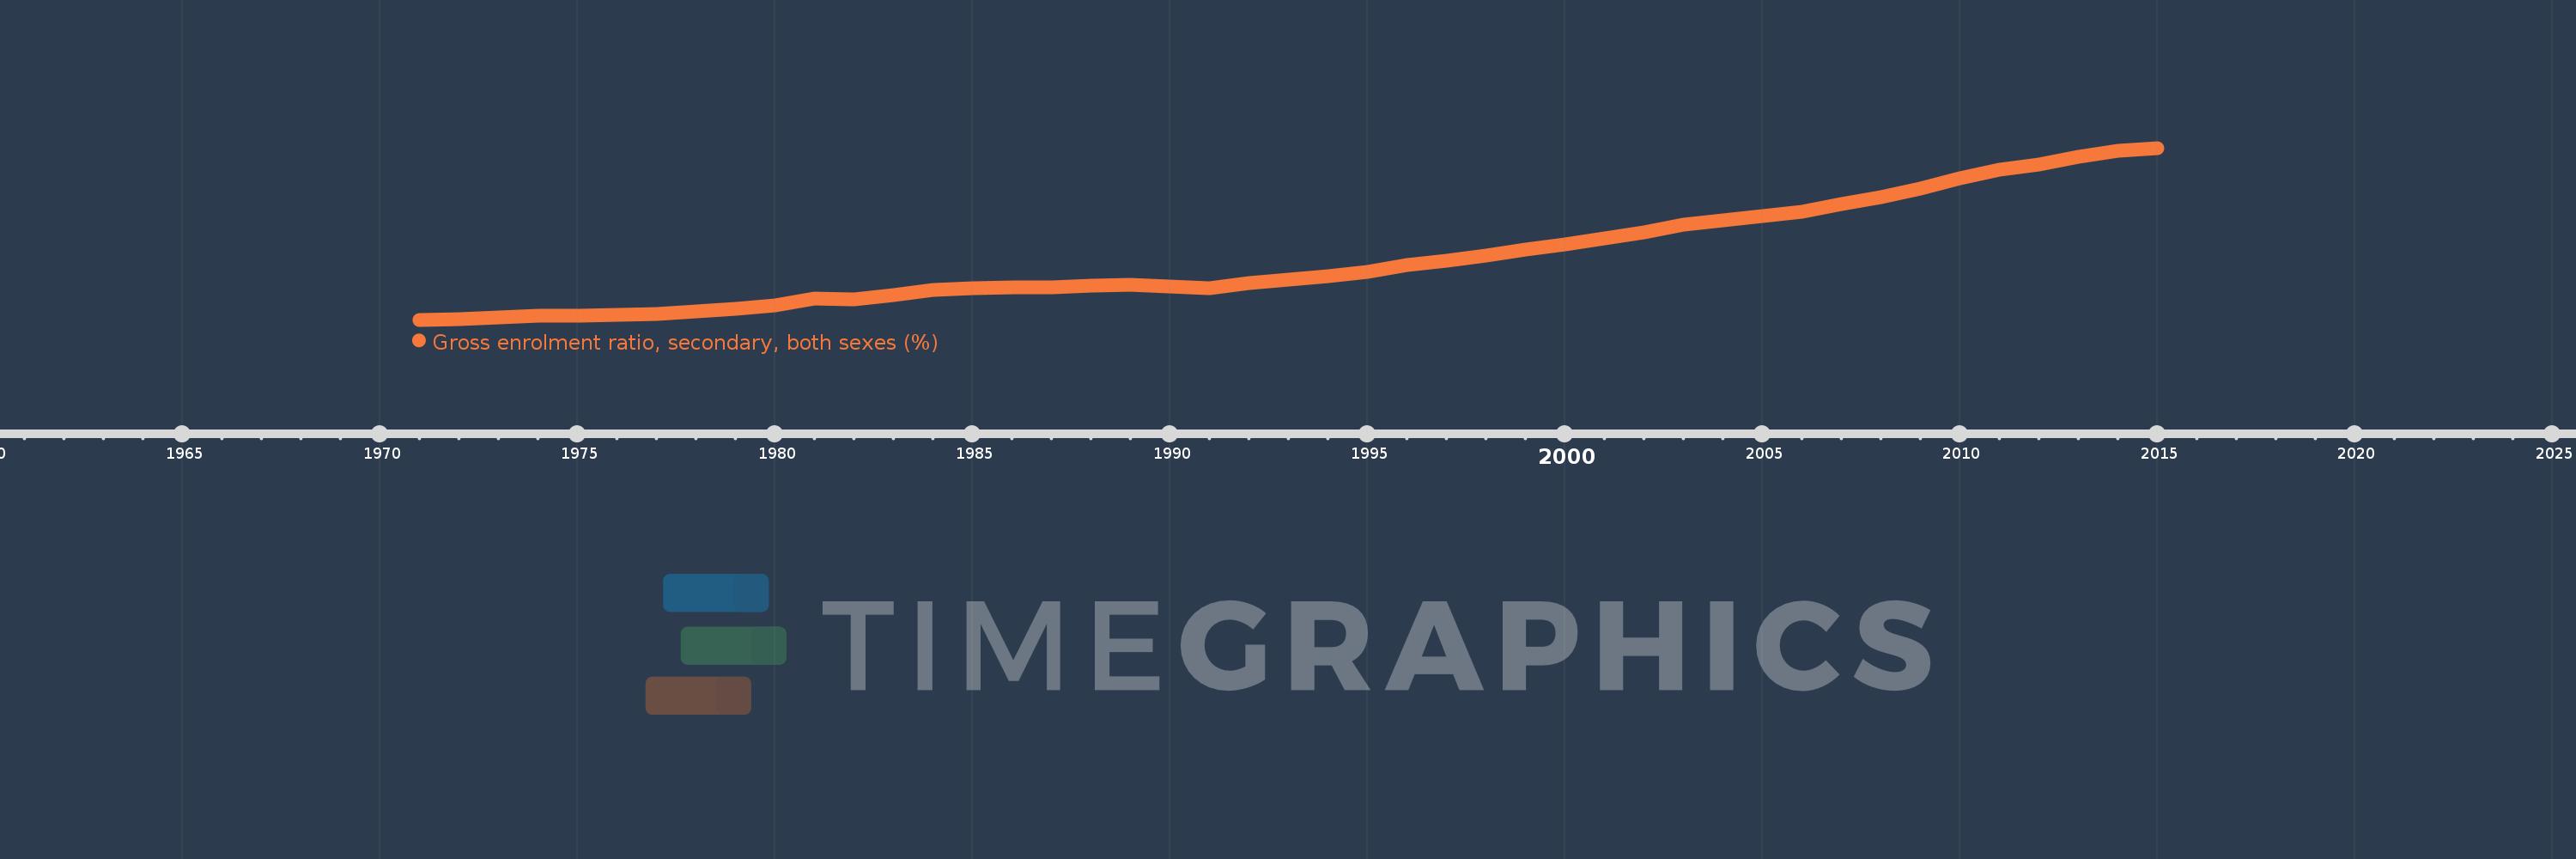
Gross enrolment ratio, secondary, both sexes (%)
2015,2014,2013,2012,2011,2010,2009,2008,2007,2006,2005,2004,2003,2002,2001,2000,1999,1998,1997,1996,1995,1994,1993,1992,1991,1990,1989,1988,1987,1986,1985,1984,1983,1982,1981,1980,1979,1978,1977,1976,1975,1974,1973,1972,1971
This statistics in other country:
AfghanistanAlbaniaAlgeriaAndorraAngolaAntigua and BarbudaArab WorldArgentinaArmeniaArubaAustraliaAustriaAzerbaijanBahamas, TheBahrainBangladeshBarbadosBelarusBelgiumBelizeBeninBermudaBhutanBoliviaBosnia and HerzegovinaBotswanaBrazilBritish Virgin IslandsBrunei DarussalamBulgariaBurkina FasoBurundiCabo VerdeCambodiaCameroonCanadaCaribbean small statesCentral African RepublicCentral Europe and the BalticsChadChileChinaColombiaComorosCongo, Dem. Rep.Congo, Rep.Costa RicaCote d'IvoireCroatiaCubaCuracaoCyprusCzech RepublicDenmarkDjiboutiDominicaDominican RepublicEarly-demographic dividendEast Asia & PacificEast Asia & Pacific (excluding high income)East Asia & Pacific (IDA & IBRD countries)EcuadorEgypt, Arab Rep.El SalvadorEquatorial GuineaEritreaEstoniaEthiopiaEuro areaEurope & Central AsiaEurope & Central Asia (excluding high income)Europe & Central Asia (IDA & IBRD countries)European UnionFijiFinlandFragile and conflict affected situationsFranceGabonGambia, TheGeorgiaGermanyGhanaGreeceGrenadaGuatemalaGuineaGuinea-BissauGuyanaHaitiHeavily indebted poor countries (HIPC)High incomeHondurasHong Kong SAR, ChinaHungaryIBRD onlyIcelandIDA & IBRD totalIDA blendIDA onlyIDA totalIndiaIndonesiaIran, Islamic Rep.IraqIrelandIsraelItalyJamaicaJapanJordanKazakhstanKenyaKiribatiKorea, Dem. People’s Rep.Korea, Rep.KuwaitKyrgyz RepublicLao PDRLate-demographic dividendLatin America & Caribbean Latin America & Caribbean (excluding high income)Latin America & the Caribbean (IDA & IBRD countries)LatviaLeast developed countries: UN classificationLebanonLesothoLiberiaLibyaLiechtensteinLithuaniaLow & middle incomeLow incomeLower middle incomeLuxembourgMacao SAR, ChinaMacedonia, FYRMadagascarMalawiMalaysiaMaldivesMaliMaltaMarshall IslandsMauritaniaMauritiusMexicoMicronesia, Fed. Sts.Middle East & North AfricaMiddle East & North Africa (excluding high income)Middle East & North Africa (IDA & IBRD countries)Middle incomeMoldovaMongoliaMontenegroMoroccoMozambiqueMyanmarNamibiaNauruNepalNetherlandsNew ZealandNicaraguaNigerNigeriaNorth AmericaNorwayOECD membersOmanOther small statesPacific island small statesPakistanPalauPanamaPapua New GuineaParaguayPeruPhilippinesPolandPortugalPost-demographic dividendPre-demographic dividendPuerto RicoQatarRomaniaRussian FederationRwandaSamoaSan MarinoSao Tome and PrincipeSaudi ArabiaSenegalSerbiaSeychellesSierra LeoneSlovak RepublicSloveniaSmall statesSolomon IslandsSomaliaSouth AfricaSouth AsiaSouth Asia (IDA & IBRD)SpainSri LankaSt. Kitts and NevisSt. LuciaSt. Vincent and the GrenadinesSub-Saharan Africa Sub-Saharan Africa (excluding high income)Sub-Saharan Africa (IDA & IBRD countries)SudanSurinameSwazilandSwedenSwitzerlandSyrian Arab RepublicTajikistanTanzaniaThailandTimor-LesteTogoTongaTrinidad and TobagoTunisiaTurkeyTurkmenistanTuvaluUgandaUkraineUnited Arab EmiratesUnited KingdomUnited StatesUpper middle incomeUruguayUzbekistanVanuatuVenezuela, RBVietnamWest Bank and GazaWorldYemen, Rep.ZambiaZimbabwe Timeline:
This timeline shows a graph from 1971 to 2015 of IDA only. No data until 1970. Number of actual observations by date: 45.
Source name:
World Development Indicators
Source organization:
UNESCO Institute for Statistics
Categories, topics:
Education
Last updated:
apr 23, 2017
Indicators value changes by year
Minimum:
16.225
jan 1, 1971
Maximum:
45.762
jan 1, 2015
At the date of observation
Value
Absolute change
Change from previous value
jan 1, 1971
16.225
+16.225
0.0%
jan 1, 1972
16.321
+0.097
0.6%
jan 1, 1973
16.604
+0.282
1.73%
jan 1, 1974
16.923
+0.319
1.92%
jan 1, 1975
16.876
-0.047
-0.27%
jan 1, 1976
17.073
+0.197
1.17%
jan 1, 1977
17.235
+0.162
0.95%
jan 1, 1978
17.618
+0.383
2.22%
jan 1, 1979
18.106
+0.488
2.77%
jan 1, 1980
18.748
+0.642
3.55%
jan 1, 1981
19.825
+1.077
5.75%
jan 1, 1982
19.686
-0.139
-0.7%
jan 1, 1983
20.497
+0.81
4.12%
jan 1, 1984
21.31
+0.814
3.97%
jan 1, 1985
21.629
+0.318
1.49%
jan 1, 1986
21.866
+0.237
1.1%
jan 1, 1987
21.765
-0.101
-0.46%
jan 1, 1988
22.035
+0.27
1.24%
jan 1, 1989
22.221
+0.186
0.84%
jan 1, 1990
21.972
-0.249
-1.12%
jan 1, 1991
21.634
-0.337
-1.54%
jan 1, 1992
22.505
+0.871
4.02%
jan 1, 1993
23.152
+0.647
2.88%
jan 1, 1994
23.732
+0.579
2.5%
jan 1, 1995
24.515
+0.783
3.3%
jan 1, 1996
25.703
+1.188
4.85%
jan 1, 1997
26.431
+0.728
2.83%
jan 1, 1998
27.193
+0.763
2.88%
jan 1, 1999
28.289
+1.096
4.03%
jan 1, 2000
29.217
+0.928
3.28%
jan 1, 2001
30.231
+1.013
3.47%
jan 1, 2002
31.269
+1.038
3.43%
jan 1, 2003
32.577
+1.308
4.18%
jan 1, 2004
33.364
+0.787
2.42%
jan 1, 2005
34.038
+0.675
2.02%
jan 1, 2006
34.769
+0.731
2.15%
jan 1, 2007
36.142
+1.372
3.95%
jan 1, 2008
37.278
+1.137
3.15%
jan 1, 2009
38.765
+1.486
3.99%
jan 1, 2010
40.529
+1.765
4.55%
jan 1, 2011
41.999
+1.47
3.63%
jan 1, 2012
42.961
+0.962
2.29%
jan 1, 2013
44.169
+1.208
2.81%
jan 1, 2014
45.314
+1.145
2.59%
jan 1, 2015
45.762
+0.448
0.99%
Ranking of countries by current statistics by years


Comments: