29
/
en
AIzaSyAYiBZKx7MnpbEhh9jyipgxe19OcubqV5w
April 1, 2024
154657
India
IND
true
2
1
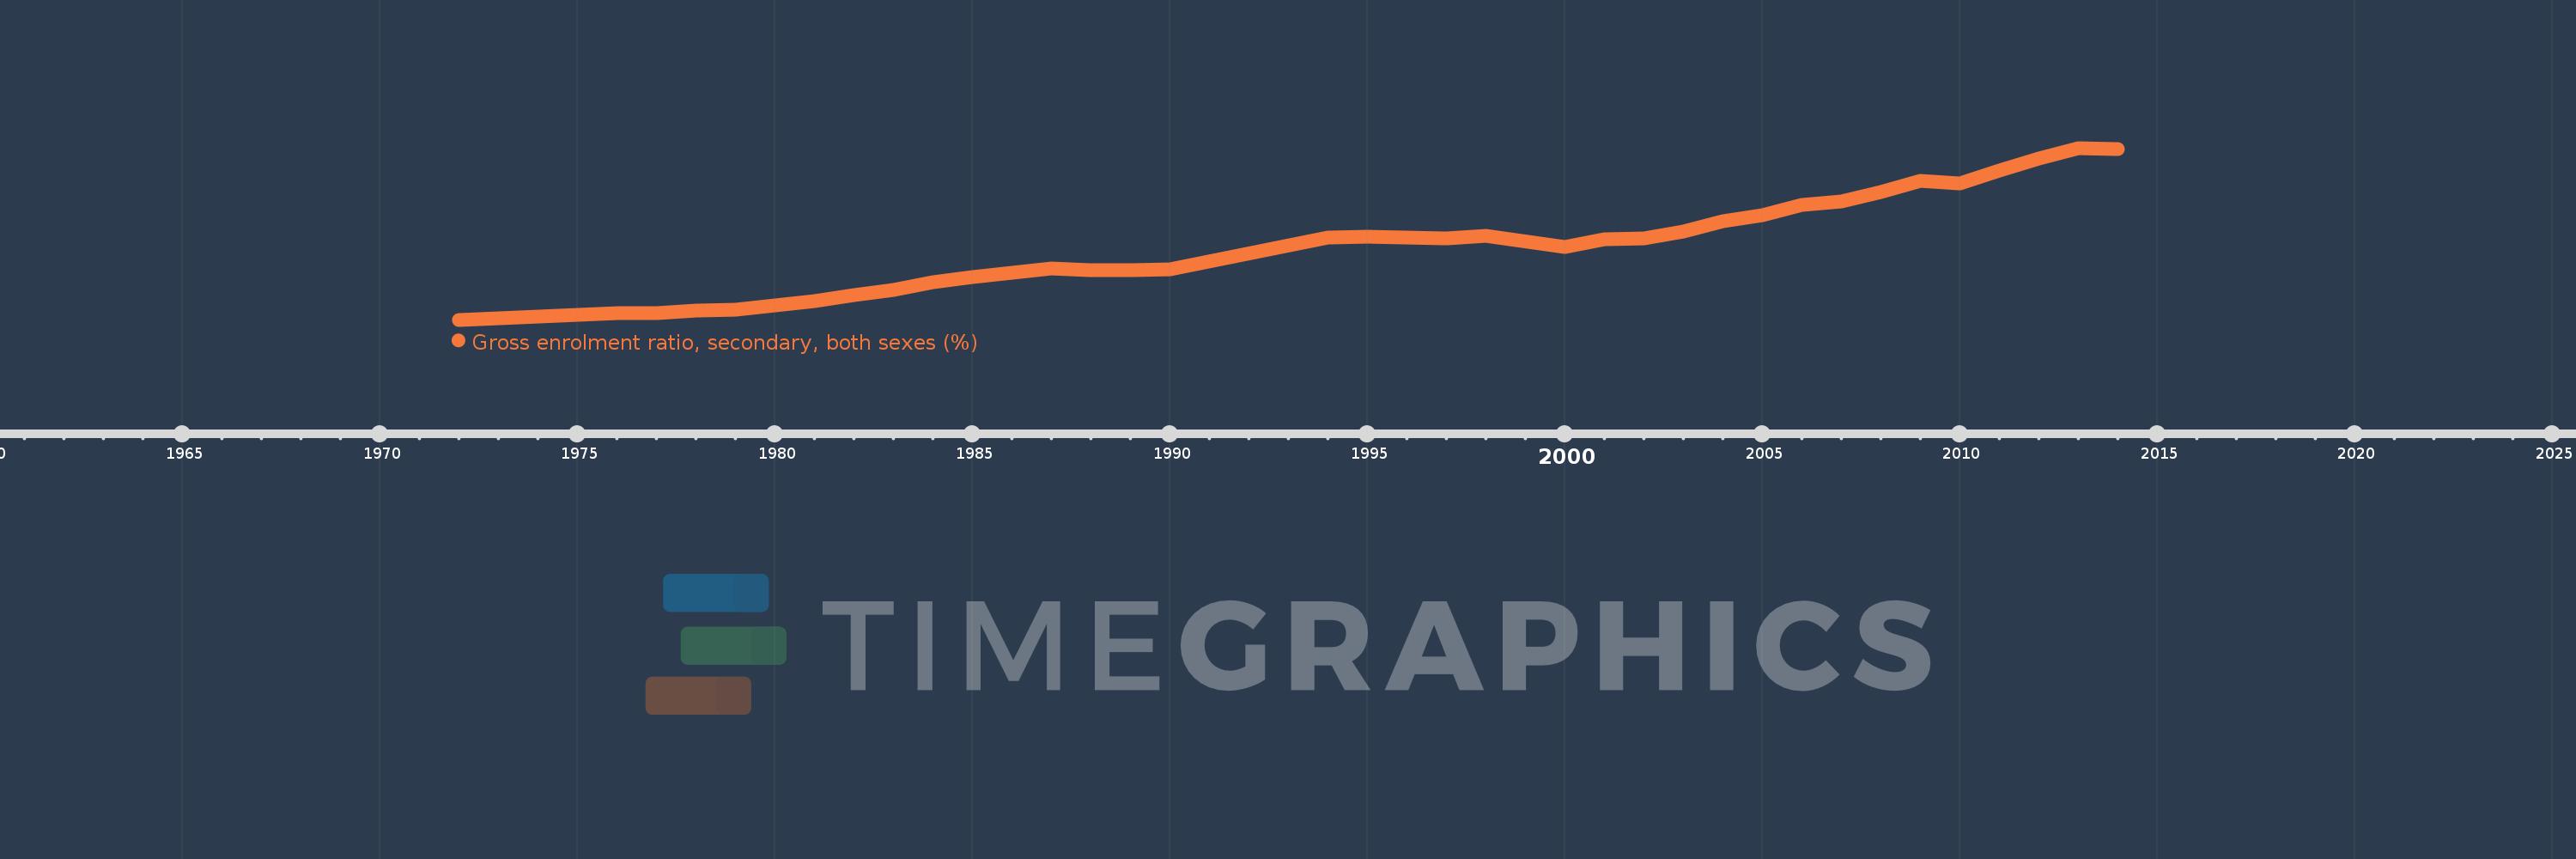
Gross enrolment ratio, secondary, both sexes (%)
2014,2013,2012,2011,2010,2009,2008,2007,2006,2005,2004,2003,2002,2001,2000,1998,1997,1996,1995,1994,1990,1989,1988,1987,1985,1984,1983,1982,1981,1979,1978,1977,1976,1974,1973,1972
This statistics in other country:
AfghanistanAlbaniaAlgeriaAndorraAngolaAntigua and BarbudaArab WorldArgentinaArmeniaArubaAustraliaAustriaAzerbaijanBahamas, TheBahrainBangladeshBarbadosBelarusBelgiumBelizeBeninBermudaBhutanBoliviaBosnia and HerzegovinaBotswanaBrazilBritish Virgin IslandsBrunei DarussalamBulgariaBurkina FasoBurundiCabo VerdeCambodiaCameroonCanadaCaribbean small statesCentral African RepublicCentral Europe and the BalticsChadChileChinaColombiaComorosCongo, Dem. Rep.Congo, Rep.Costa RicaCote d'IvoireCroatiaCubaCuracaoCyprusCzech RepublicDenmarkDjiboutiDominicaDominican RepublicEarly-demographic dividendEast Asia & PacificEast Asia & Pacific (excluding high income)East Asia & Pacific (IDA & IBRD countries)EcuadorEgypt, Arab Rep.El SalvadorEquatorial GuineaEritreaEstoniaEthiopiaEuro areaEurope & Central AsiaEurope & Central Asia (excluding high income)Europe & Central Asia (IDA & IBRD countries)European UnionFijiFinlandFragile and conflict affected situationsFranceGabonGambia, TheGeorgiaGermanyGhanaGreeceGrenadaGuatemalaGuineaGuinea-BissauGuyanaHaitiHeavily indebted poor countries (HIPC)High incomeHondurasHong Kong SAR, ChinaHungaryIBRD onlyIcelandIDA & IBRD totalIDA blendIDA onlyIDA totalIndiaIndonesiaIran, Islamic Rep.IraqIrelandIsraelItalyJamaicaJapanJordanKazakhstanKenyaKiribatiKorea, Dem. People’s Rep.Korea, Rep.KuwaitKyrgyz RepublicLao PDRLate-demographic dividendLatin America & Caribbean Latin America & Caribbean (excluding high income)Latin America & the Caribbean (IDA & IBRD countries)LatviaLeast developed countries: UN classificationLebanonLesothoLiberiaLibyaLiechtensteinLithuaniaLow & middle incomeLow incomeLower middle incomeLuxembourgMacao SAR, ChinaMacedonia, FYRMadagascarMalawiMalaysiaMaldivesMaliMaltaMarshall IslandsMauritaniaMauritiusMexicoMicronesia, Fed. Sts.Middle East & North AfricaMiddle East & North Africa (excluding high income)Middle East & North Africa (IDA & IBRD countries)Middle incomeMoldovaMongoliaMontenegroMoroccoMozambiqueMyanmarNamibiaNauruNepalNetherlandsNew ZealandNicaraguaNigerNigeriaNorth AmericaNorwayOECD membersOmanOther small statesPacific island small statesPakistanPalauPanamaPapua New GuineaParaguayPeruPhilippinesPolandPortugalPost-demographic dividendPre-demographic dividendPuerto RicoQatarRomaniaRussian FederationRwandaSamoaSan MarinoSao Tome and PrincipeSaudi ArabiaSenegalSerbiaSeychellesSierra LeoneSlovak RepublicSloveniaSmall statesSolomon IslandsSomaliaSouth AfricaSouth AsiaSouth Asia (IDA & IBRD)SpainSri LankaSt. Kitts and NevisSt. LuciaSt. Vincent and the GrenadinesSub-Saharan Africa Sub-Saharan Africa (excluding high income)Sub-Saharan Africa (IDA & IBRD countries)SudanSurinameSwazilandSwedenSwitzerlandSyrian Arab RepublicTajikistanTanzaniaThailandTimor-LesteTogoTongaTrinidad and TobagoTunisiaTurkeyTurkmenistanTuvaluUgandaUkraineUnited Arab EmiratesUnited KingdomUnited StatesUpper middle incomeUruguayUzbekistanVanuatuVenezuela, RBVietnamWest Bank and GazaWorldYemen, Rep.ZambiaZimbabwe Timeline:
This timeline shows a graph from 1972 to 2014 of India. No data until 1971. Number of actual observations by date: 36.
Source name:
World Development Indicators
Source organization:
UNESCO Institute for Statistics
Categories, topics:
Education
Last updated:
apr 23, 2017
Indicators value changes by year
Minimum:
24.026
jan 1, 1972
Maximum:
69.164
jan 1, 2013
At the date of observation
Value
Absolute change
Change from previous value
jan 1, 1972
24.026
+24.026
0.0%
jan 1, 1973
24.495
+0.469
1.95%
jan 1, 1974
24.966
+0.471
1.92%
jan 1, 1976
25.664
+0.698
2.79%
jan 1, 1977
25.818
+0.154
0.6%
jan 1, 1978
26.387
+0.569
2.21%
jan 1, 1979
26.761
+0.374
1.42%
jan 1, 1981
28.946
+2.185
8.16%
jan 1, 1982
30.396
+1.45
5.01%
jan 1, 1983
31.911
+1.515
4.98%
jan 1, 1984
33.91
+1.999
6.26%
jan 1, 1985
35.298
+1.388
4.09%
jan 1, 1987
37.409
+2.111
5.98%
jan 1, 1988
37.03
-0.379
-1.01%
jan 1, 1989
37.12
+0.09
0.24%
jan 1, 1990
37.292
+0.172
0.46%
jan 1, 1994
45.514
+8.221
22.05%
jan 1, 1995
45.837
+0.323
0.71%
jan 1, 1996
45.543
-0.294
-0.64%
jan 1, 1997
45.477
-0.066
-0.14%
jan 1, 1998
46.03
+0.554
1.22%
jan 1, 2000
43.222
-2.809
-6.1%
jan 1, 2001
45.064
+1.842
4.26%
jan 1, 2002
45.341
+0.278
0.62%
jan 1, 2003
47.266
+1.925
4.25%
jan 1, 2004
49.823
+2.557
5.41%
jan 1, 2005
51.572
+1.749
3.51%
jan 1, 2006
54.173
+2.601
5.04%
jan 1, 2007
55.082
+0.91
1.68%
jan 1, 2008
57.477
+2.395
4.35%
jan 1, 2009
60.556
+3.079
5.36%
jan 1, 2010
59.794
-0.762
-1.26%
jan 1, 2011
63.291
+3.497
5.85%
jan 1, 2012
66.422
+3.131
4.95%
jan 1, 2013
69.164
+2.742
4.13%
jan 1, 2014
68.897
-0.267
-0.39%
Ranking of countries by current statistics by years


Comments: