29
/
en
AIzaSyAYiBZKx7MnpbEhh9jyipgxe19OcubqV5w
April 1, 2024
41493
Latin America & Caribbean
LCN
false
2
1
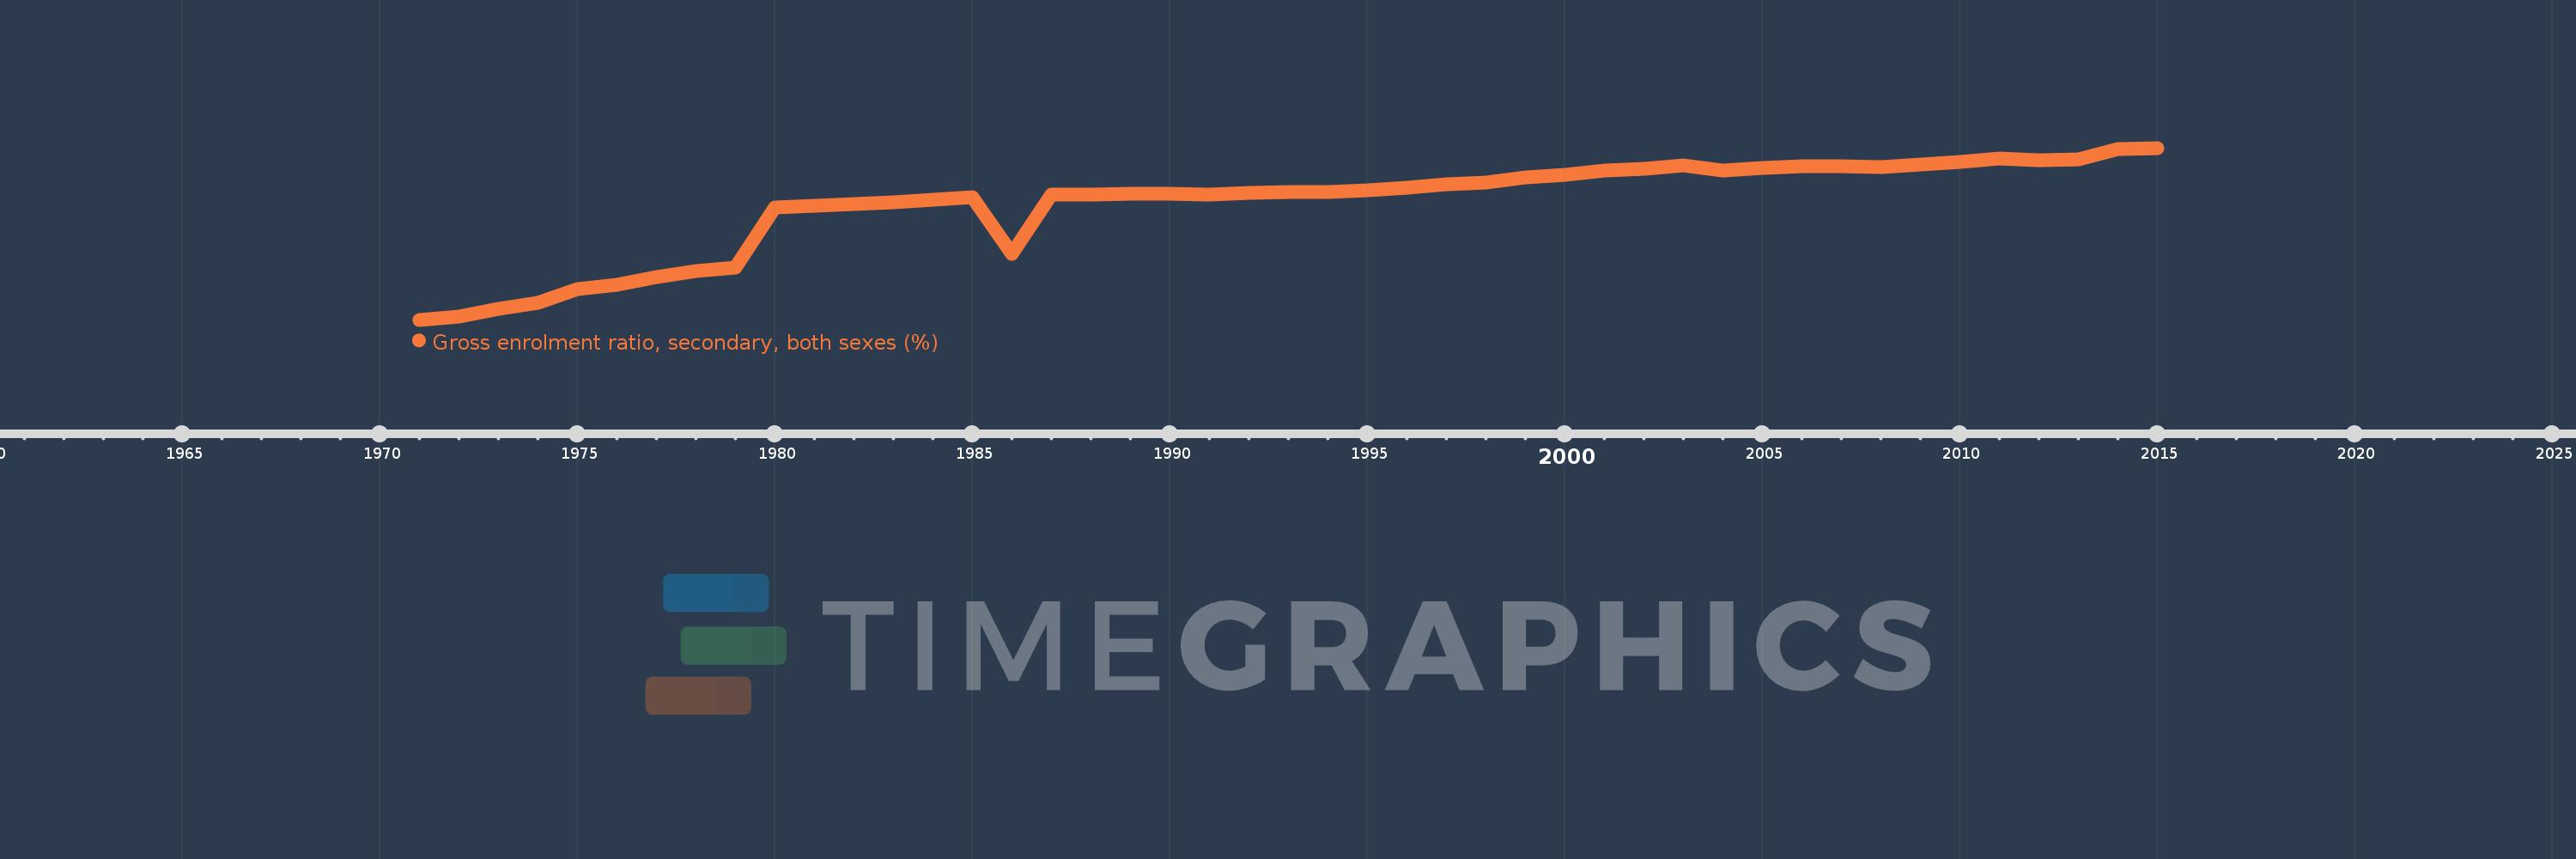
Gross enrolment ratio, secondary, both sexes (%)
2015,2014,2013,2012,2011,2010,2009,2008,2007,2006,2005,2004,2003,2002,2001,2000,1999,1998,1997,1996,1995,1994,1993,1992,1991,1990,1989,1988,1987,1986,1985,1984,1983,1982,1981,1980,1979,1978,1977,1976,1975,1974,1973,1972,1971
This statistics in other country:
AfghanistanAlbaniaAlgeriaAndorraAngolaAntigua and BarbudaArab WorldArgentinaArmeniaArubaAustraliaAustriaAzerbaijanBahamas, TheBahrainBangladeshBarbadosBelarusBelgiumBelizeBeninBermudaBhutanBoliviaBosnia and HerzegovinaBotswanaBrazilBritish Virgin IslandsBrunei DarussalamBulgariaBurkina FasoBurundiCabo VerdeCambodiaCameroonCanadaCaribbean small statesCentral African RepublicCentral Europe and the BalticsChadChileChinaColombiaComorosCongo, Dem. Rep.Congo, Rep.Costa RicaCote d'IvoireCroatiaCubaCuracaoCyprusCzech RepublicDenmarkDjiboutiDominicaDominican RepublicEarly-demographic dividendEast Asia & PacificEast Asia & Pacific (excluding high income)East Asia & Pacific (IDA & IBRD countries)EcuadorEgypt, Arab Rep.El SalvadorEquatorial GuineaEritreaEstoniaEthiopiaEuro areaEurope & Central AsiaEurope & Central Asia (excluding high income)Europe & Central Asia (IDA & IBRD countries)European UnionFijiFinlandFragile and conflict affected situationsFranceGabonGambia, TheGeorgiaGermanyGhanaGreeceGrenadaGuatemalaGuineaGuinea-BissauGuyanaHaitiHeavily indebted poor countries (HIPC)High incomeHondurasHong Kong SAR, ChinaHungaryIBRD onlyIcelandIDA & IBRD totalIDA blendIDA onlyIDA totalIndiaIndonesiaIran, Islamic Rep.IraqIrelandIsraelItalyJamaicaJapanJordanKazakhstanKenyaKiribatiKorea, Dem. People’s Rep.Korea, Rep.KuwaitKyrgyz RepublicLao PDRLate-demographic dividendLatin America & Caribbean Latin America & Caribbean (excluding high income)Latin America & the Caribbean (IDA & IBRD countries)LatviaLeast developed countries: UN classificationLebanonLesothoLiberiaLibyaLiechtensteinLithuaniaLow & middle incomeLow incomeLower middle incomeLuxembourgMacao SAR, ChinaMacedonia, FYRMadagascarMalawiMalaysiaMaldivesMaliMaltaMarshall IslandsMauritaniaMauritiusMexicoMicronesia, Fed. Sts.Middle East & North AfricaMiddle East & North Africa (excluding high income)Middle East & North Africa (IDA & IBRD countries)Middle incomeMoldovaMongoliaMontenegroMoroccoMozambiqueMyanmarNamibiaNauruNepalNetherlandsNew ZealandNicaraguaNigerNigeriaNorth AmericaNorwayOECD membersOmanOther small statesPacific island small statesPakistanPalauPanamaPapua New GuineaParaguayPeruPhilippinesPolandPortugalPost-demographic dividendPre-demographic dividendPuerto RicoQatarRomaniaRussian FederationRwandaSamoaSan MarinoSao Tome and PrincipeSaudi ArabiaSenegalSerbiaSeychellesSierra LeoneSlovak RepublicSloveniaSmall statesSolomon IslandsSomaliaSouth AfricaSouth AsiaSouth Asia (IDA & IBRD)SpainSri LankaSt. Kitts and NevisSt. LuciaSt. Vincent and the GrenadinesSub-Saharan Africa Sub-Saharan Africa (excluding high income)Sub-Saharan Africa (IDA & IBRD countries)SudanSurinameSwazilandSwedenSwitzerlandSyrian Arab RepublicTajikistanTanzaniaThailandTimor-LesteTogoTongaTrinidad and TobagoTunisiaTurkeyTurkmenistanTuvaluUgandaUkraineUnited Arab EmiratesUnited KingdomUnited StatesUpper middle incomeUruguayUzbekistanVanuatuVenezuela, RBVietnamWest Bank and GazaWorldYemen, Rep.ZambiaZimbabwe Timeline:
This timeline shows a graph from 1971 to 2015 of Latin America & Caribbean . No data until 1970. Number of actual observations by date: 45.
Source name:
World Development Indicators
Source organization:
UNESCO Institute for Statistics
Categories, topics:
Education
Last updated:
apr 23, 2017
Indicators value changes by year
Minimum:
27.447
jan 1, 1971
Maximum:
94.097
jan 1, 2015
At the date of observation
Value
Absolute change
Change from previous value
jan 1, 1971
27.447
+27.447
0.0%
jan 1, 1972
28.662
+1.215
4.43%
jan 1, 1973
31.8
+3.138
10.95%
jan 1, 1974
34.015
+2.215
6.97%
jan 1, 1975
39.213
+5.198
15.28%
jan 1, 1976
41.074
+1.861
4.75%
jan 1, 1977
43.898
+2.824
6.88%
jan 1, 1978
46.411
+2.513
5.72%
jan 1, 1979
47.802
+1.391
3.0%
jan 1, 1980
70.855
+23.054
48.23%
jan 1, 1981
71.748
+0.893
1.26%
jan 1, 1982
72.444
+0.696
0.97%
jan 1, 1983
73.164
+0.719
0.99%
jan 1, 1984
74.109
+0.946
1.29%
jan 1, 1985
74.963
+0.853
1.15%
jan 1, 1986
53.167
-21.795
-29.07%
jan 1, 1987
76.008
+22.84
42.96%
jan 1, 1988
76.141
+0.133
0.17%
jan 1, 1989
76.281
+0.14
0.18%
jan 1, 1990
76.261
-0.02
-0.03%
jan 1, 1991
76.107
-0.153
-0.2%
jan 1, 1992
76.539
+0.432
0.57%
jan 1, 1993
77.119
+0.58
0.76%
jan 1, 1994
77.042
-0.077
-0.1%
jan 1, 1995
77.679
+0.637
0.83%
jan 1, 1996
78.677
+0.999
1.29%
jan 1, 1997
80.067
+1.39
1.77%
jan 1, 1998
80.785
+0.718
0.9%
jan 1, 1999
82.605
+1.82
2.25%
jan 1, 2000
83.673
+1.068
1.29%
jan 1, 2001
85.313
+1.64
1.96%
jan 1, 2002
86.083
+0.769
0.9%
jan 1, 2003
87.331
+1.249
1.45%
jan 1, 2004
85.249
-2.083
-2.38%
jan 1, 2005
86.484
+1.235
1.45%
jan 1, 2006
86.866
+0.382
0.44%
jan 1, 2007
86.837
-0.029
-0.03%
jan 1, 2008
86.529
-0.308
-0.36%
jan 1, 2009
87.779
+1.25
1.44%
jan 1, 2010
88.538
+0.759
0.86%
jan 1, 2011
89.833
+1.295
1.46%
jan 1, 2012
89.281
-0.553
-0.62%
jan 1, 2013
89.658
+0.378
0.42%
jan 1, 2014
93.516
+3.858
4.3%
jan 1, 2015
94.097
+0.581
0.62%
Ranking of countries by current statistics by years


Comments: