29
/
en
AIzaSyAYiBZKx7MnpbEhh9jyipgxe19OcubqV5w
April 1, 2024
229808
Russian Federation
RUS
true
2
1
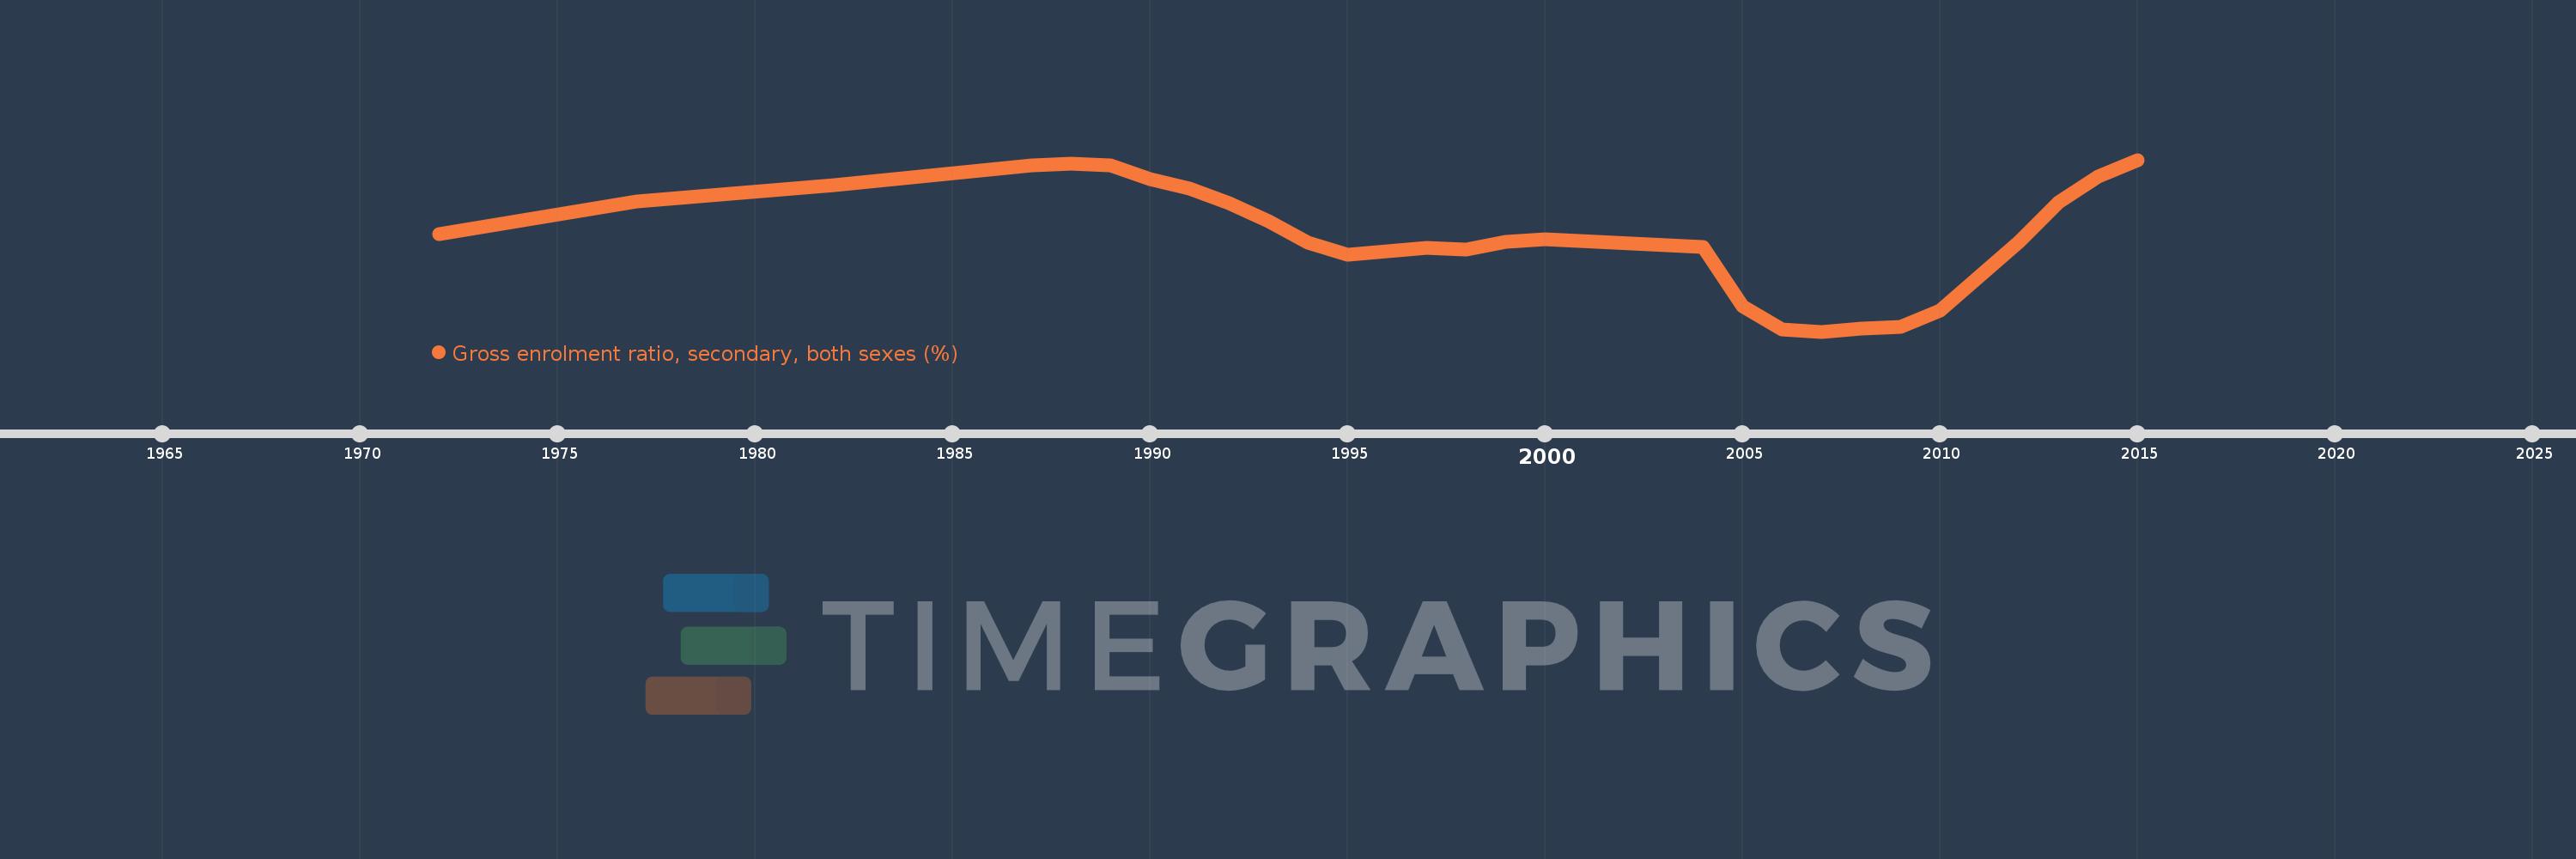
Gross enrolment ratio, secondary, both sexes (%)
2015,2014,2013,2012,2010,2009,2008,2007,2006,2005,2004,2000,1999,1998,1997,1996,1995,1994,1993,1992,1991,1990,1989,1988,1987,1982,1977,1972
This statistics in other country:
AfghanistanAlbaniaAlgeriaAndorraAngolaAntigua and BarbudaArab WorldArgentinaArmeniaArubaAustraliaAustriaAzerbaijanBahamas, TheBahrainBangladeshBarbadosBelarusBelgiumBelizeBeninBermudaBhutanBoliviaBosnia and HerzegovinaBotswanaBrazilBritish Virgin IslandsBrunei DarussalamBulgariaBurkina FasoBurundiCabo VerdeCambodiaCameroonCanadaCaribbean small statesCentral African RepublicCentral Europe and the BalticsChadChileChinaColombiaComorosCongo, Dem. Rep.Congo, Rep.Costa RicaCote d'IvoireCroatiaCubaCuracaoCyprusCzech RepublicDenmarkDjiboutiDominicaDominican RepublicEarly-demographic dividendEast Asia & PacificEast Asia & Pacific (excluding high income)East Asia & Pacific (IDA & IBRD countries)EcuadorEgypt, Arab Rep.El SalvadorEquatorial GuineaEritreaEstoniaEthiopiaEuro areaEurope & Central AsiaEurope & Central Asia (excluding high income)Europe & Central Asia (IDA & IBRD countries)European UnionFijiFinlandFragile and conflict affected situationsFranceGabonGambia, TheGeorgiaGermanyGhanaGreeceGrenadaGuatemalaGuineaGuinea-BissauGuyanaHaitiHeavily indebted poor countries (HIPC)High incomeHondurasHong Kong SAR, ChinaHungaryIBRD onlyIcelandIDA & IBRD totalIDA blendIDA onlyIDA totalIndiaIndonesiaIran, Islamic Rep.IraqIrelandIsraelItalyJamaicaJapanJordanKazakhstanKenyaKiribatiKorea, Dem. People’s Rep.Korea, Rep.KuwaitKyrgyz RepublicLao PDRLate-demographic dividendLatin America & Caribbean Latin America & Caribbean (excluding high income)Latin America & the Caribbean (IDA & IBRD countries)LatviaLeast developed countries: UN classificationLebanonLesothoLiberiaLibyaLiechtensteinLithuaniaLow & middle incomeLow incomeLower middle incomeLuxembourgMacao SAR, ChinaMacedonia, FYRMadagascarMalawiMalaysiaMaldivesMaliMaltaMarshall IslandsMauritaniaMauritiusMexicoMicronesia, Fed. Sts.Middle East & North AfricaMiddle East & North Africa (excluding high income)Middle East & North Africa (IDA & IBRD countries)Middle incomeMoldovaMongoliaMontenegroMoroccoMozambiqueMyanmarNamibiaNauruNepalNetherlandsNew ZealandNicaraguaNigerNigeriaNorth AmericaNorwayOECD membersOmanOther small statesPacific island small statesPakistanPalauPanamaPapua New GuineaParaguayPeruPhilippinesPolandPortugalPost-demographic dividendPre-demographic dividendPuerto RicoQatarRomaniaRussian FederationRwandaSamoaSan MarinoSao Tome and PrincipeSaudi ArabiaSenegalSerbiaSeychellesSierra LeoneSlovak RepublicSloveniaSmall statesSolomon IslandsSomaliaSouth AfricaSouth AsiaSouth Asia (IDA & IBRD)SpainSri LankaSt. Kitts and NevisSt. LuciaSt. Vincent and the GrenadinesSub-Saharan Africa Sub-Saharan Africa (excluding high income)Sub-Saharan Africa (IDA & IBRD countries)SudanSurinameSwazilandSwedenSwitzerlandSyrian Arab RepublicTajikistanTanzaniaThailandTimor-LesteTogoTongaTrinidad and TobagoTunisiaTurkeyTurkmenistanTuvaluUgandaUkraineUnited Arab EmiratesUnited KingdomUnited StatesUpper middle incomeUruguayUzbekistanVanuatuVenezuela, RBVietnamWest Bank and GazaWorldYemen, Rep.ZambiaZimbabwe Timeline:
This timeline shows a graph from 1972 to 2015 of Russian Federation. No data until 1971. Number of actual observations by date: 28.
Source name:
World Development Indicators
Source organization:
UNESCO Institute for Statistics
Categories, topics:
Education
Last updated:
apr 23, 2017
Indicators value changes by year
Minimum:
82.745
jan 1, 2007
Maximum:
100.586
jan 1, 2015
At the date of observation
Value
Absolute change
Change from previous value
jan 1, 1972
92.859
+92.859
0.0%
jan 1, 1977
96.276
+3.417
3.68%
jan 1, 1982
97.962
+1.685
1.75%
jan 1, 1987
100.018
+2.056
2.1%
jan 1, 1988
100.217
+0.199
0.2%
jan 1, 1989
99.974
-0.243
-0.24%
jan 1, 1990
98.585
-1.389
-1.39%
jan 1, 1991
97.608
-0.977
-0.99%
jan 1, 1992
96.124
-1.484
-1.52%
jan 1, 1993
94.206
-1.918
-2.0%
jan 1, 1994
91.99
-2.215
-2.35%
jan 1, 1995
90.69
-1.3
-1.41%
jan 1, 1996
91.064
+0.374
0.41%
jan 1, 1997
91.408
+0.343
0.38%
jan 1, 1998
91.249
-0.158
-0.17%
jan 1, 1999
92.047
+0.798
0.87%
jan 1, 2000
92.377
+0.33
0.36%
jan 1, 2004
91.528
-0.85
-0.92%
jan 1, 2005
85.342
-6.186
-6.76%
jan 1, 2006
82.943
-2.399
-2.81%
jan 1, 2007
82.745
-0.197
-0.24%
jan 1, 2008
83.043
+0.298
0.36%
jan 1, 2009
83.272
+0.229
0.28%
jan 1, 2010
84.957
+1.685
2.02%
jan 1, 2012
92.048
+7.091
8.35%
jan 1, 2013
96.166
+4.119
4.47%
jan 1, 2014
98.825
+2.659
2.76%
jan 1, 2015
100.586
+1.761
1.78%
Ranking of countries by current statistics by years


Comments: