30
/
AIzaSyAYiBZKx7MnpbEhh9jyipgxe19OcubqV5w
April 1, 2024
120986
Dominica
DMA
true
2
1
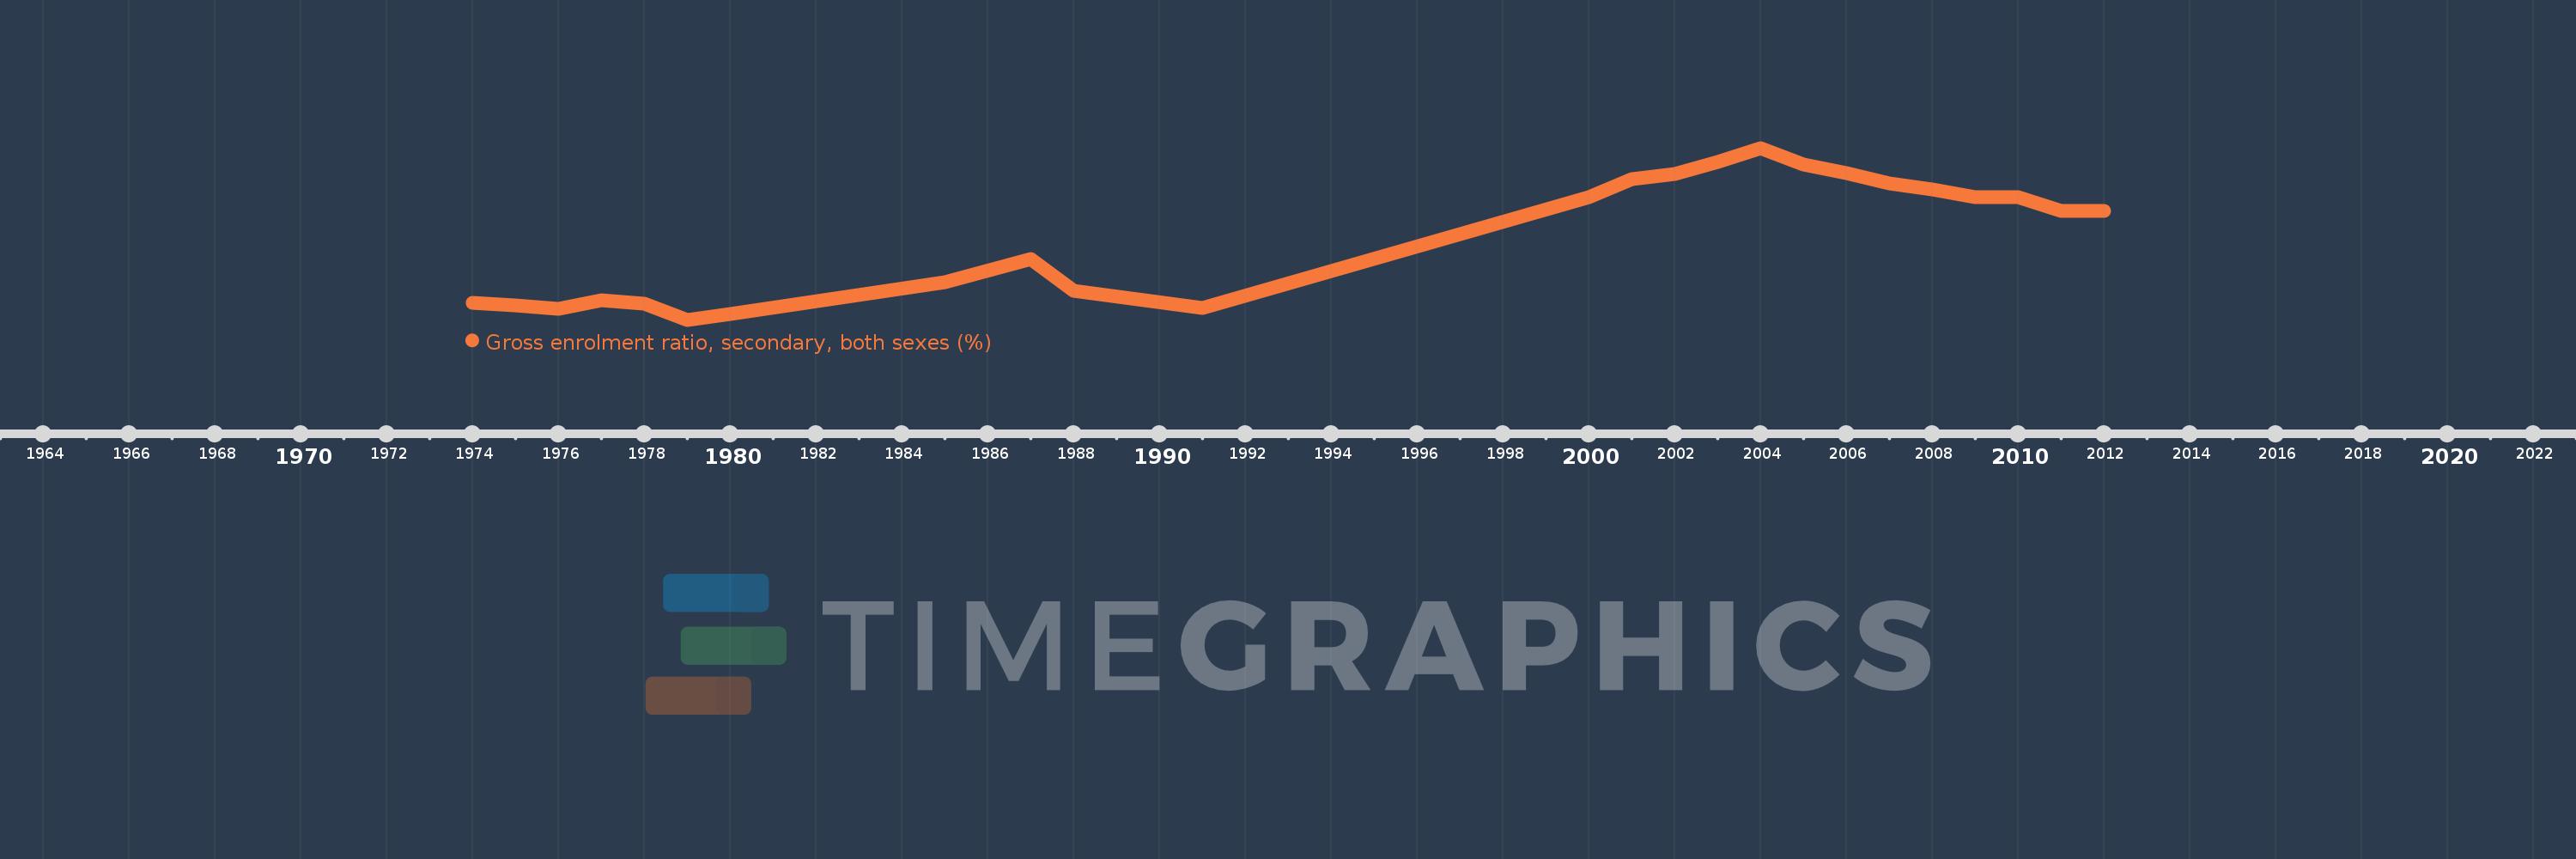
Gross enrolment ratio, secondary, both sexes (%)
2012,2011,2010,2009,2008,2007,2006,2005,2004,2003,2002,2001,2000,1991,1988,1987,1985,1980,1979,1978,1977,1976,1975,1974
