29
/
en
AIzaSyAYiBZKx7MnpbEhh9jyipgxe19OcubqV5w
April 1, 2024
140442
Ghana
GHA
true
2
1
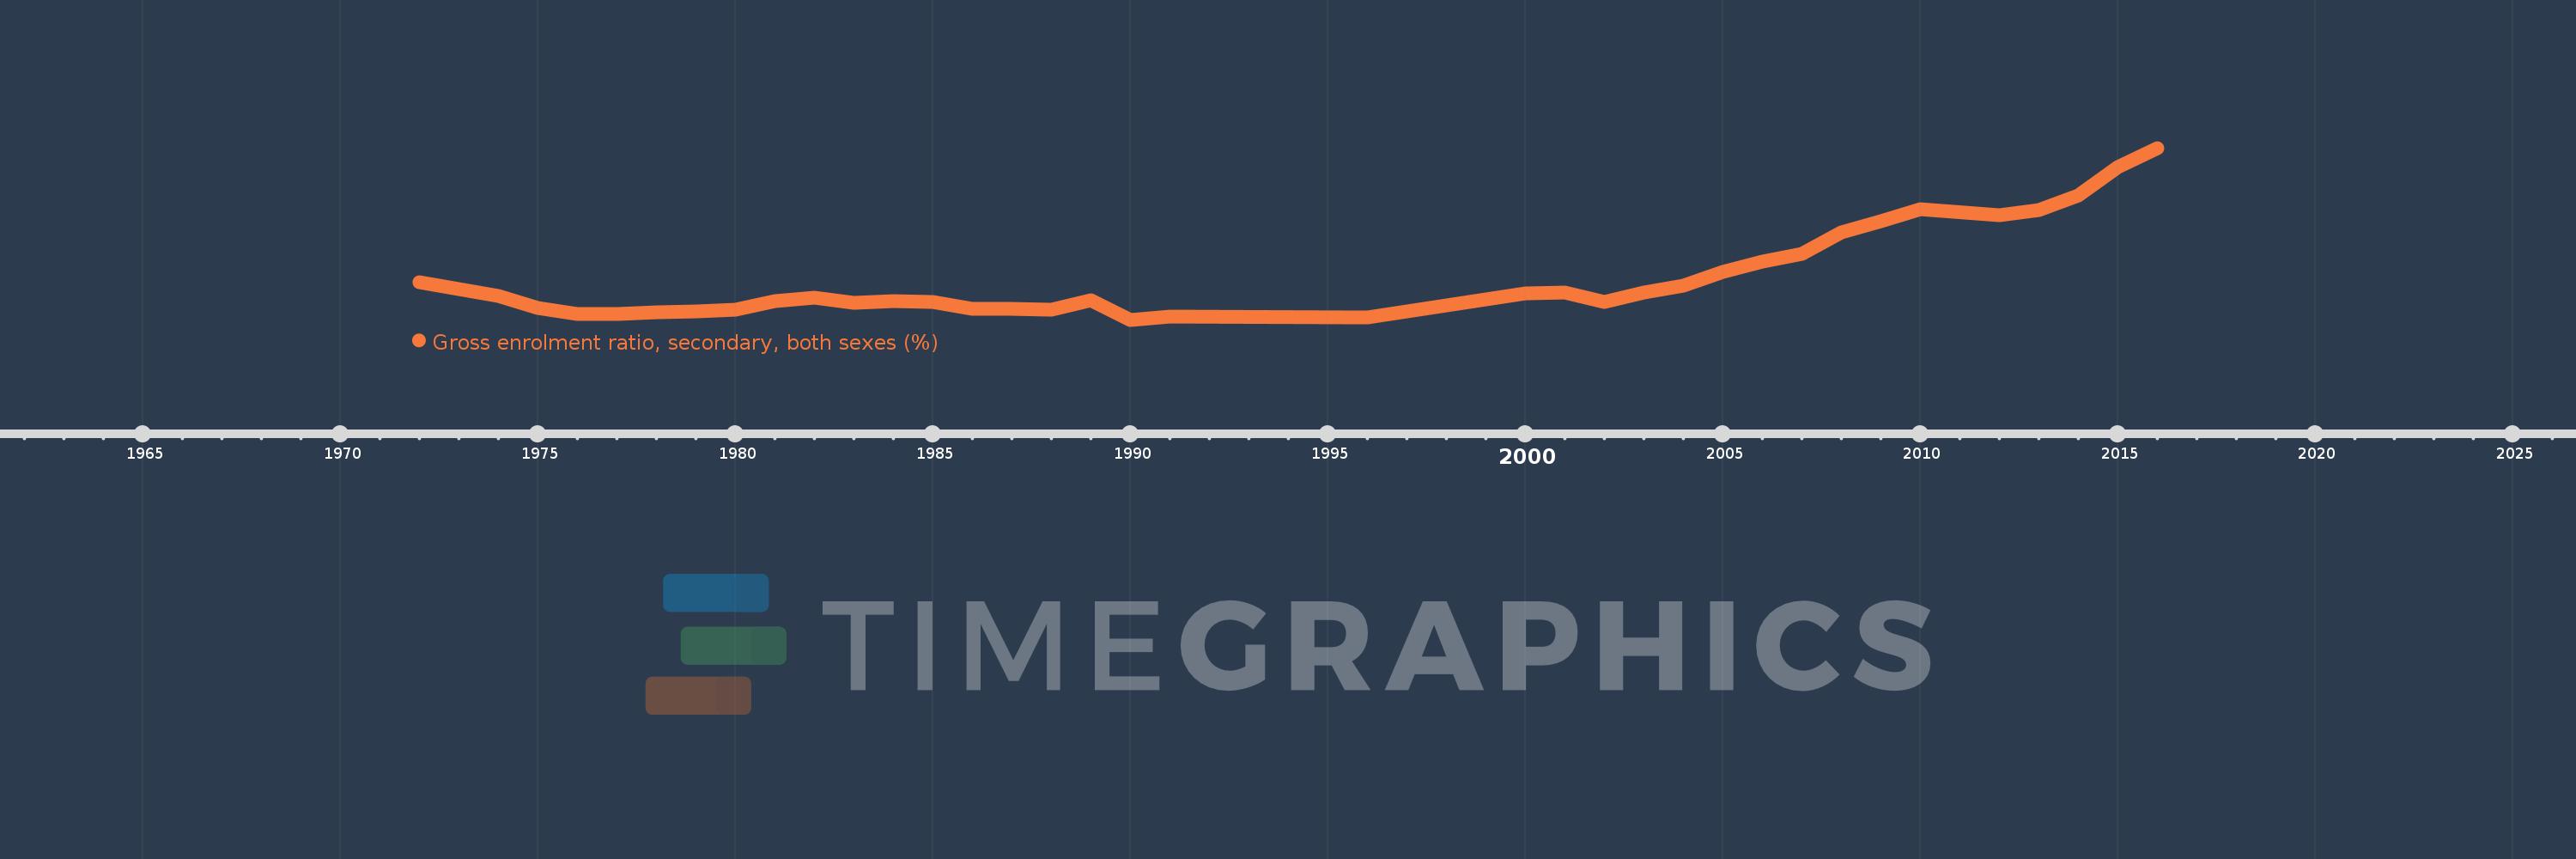
Gross enrolment ratio, secondary, both sexes (%)
2016,2015,2014,2013,2012,2010,2009,2008,2007,2006,2005,2004,2003,2002,2001,2000,1996,1991,1990,1989,1988,1987,1986,1985,1984,1983,1982,1981,1980,1979,1978,1977,1976,1975,1974,1972
This statistics in other country:
AfghanistanAlbaniaAlgeriaAndorraAngolaAntigua and BarbudaArab WorldArgentinaArmeniaArubaAustraliaAustriaAzerbaijanBahamas, TheBahrainBangladeshBarbadosBelarusBelgiumBelizeBeninBermudaBhutanBoliviaBosnia and HerzegovinaBotswanaBrazilBritish Virgin IslandsBrunei DarussalamBulgariaBurkina FasoBurundiCabo VerdeCambodiaCameroonCanadaCaribbean small statesCentral African RepublicCentral Europe and the BalticsChadChileChinaColombiaComorosCongo, Dem. Rep.Congo, Rep.Costa RicaCote d'IvoireCroatiaCubaCuracaoCyprusCzech RepublicDenmarkDjiboutiDominicaDominican RepublicEarly-demographic dividendEast Asia & PacificEast Asia & Pacific (excluding high income)East Asia & Pacific (IDA & IBRD countries)EcuadorEgypt, Arab Rep.El SalvadorEquatorial GuineaEritreaEstoniaEthiopiaEuro areaEurope & Central AsiaEurope & Central Asia (excluding high income)Europe & Central Asia (IDA & IBRD countries)European UnionFijiFinlandFragile and conflict affected situationsFranceGabonGambia, TheGeorgiaGermanyGhanaGreeceGrenadaGuatemalaGuineaGuinea-BissauGuyanaHaitiHeavily indebted poor countries (HIPC)High incomeHondurasHong Kong SAR, ChinaHungaryIBRD onlyIcelandIDA & IBRD totalIDA blendIDA onlyIDA totalIndiaIndonesiaIran, Islamic Rep.IraqIrelandIsraelItalyJamaicaJapanJordanKazakhstanKenyaKiribatiKorea, Dem. People’s Rep.Korea, Rep.KuwaitKyrgyz RepublicLao PDRLate-demographic dividendLatin America & Caribbean Latin America & Caribbean (excluding high income)Latin America & the Caribbean (IDA & IBRD countries)LatviaLeast developed countries: UN classificationLebanonLesothoLiberiaLibyaLiechtensteinLithuaniaLow & middle incomeLow incomeLower middle incomeLuxembourgMacao SAR, ChinaMacedonia, FYRMadagascarMalawiMalaysiaMaldivesMaliMaltaMarshall IslandsMauritaniaMauritiusMexicoMicronesia, Fed. Sts.Middle East & North AfricaMiddle East & North Africa (excluding high income)Middle East & North Africa (IDA & IBRD countries)Middle incomeMoldovaMongoliaMontenegroMoroccoMozambiqueMyanmarNamibiaNauruNepalNetherlandsNew ZealandNicaraguaNigerNigeriaNorth AmericaNorwayOECD membersOmanOther small statesPacific island small statesPakistanPalauPanamaPapua New GuineaParaguayPeruPhilippinesPolandPortugalPost-demographic dividendPre-demographic dividendPuerto RicoQatarRomaniaRussian FederationRwandaSamoaSan MarinoSao Tome and PrincipeSaudi ArabiaSenegalSerbiaSeychellesSierra LeoneSlovak RepublicSloveniaSmall statesSolomon IslandsSomaliaSouth AfricaSouth AsiaSouth Asia (IDA & IBRD)SpainSri LankaSt. Kitts and NevisSt. LuciaSt. Vincent and the GrenadinesSub-Saharan Africa Sub-Saharan Africa (excluding high income)Sub-Saharan Africa (IDA & IBRD countries)SudanSurinameSwazilandSwedenSwitzerlandSyrian Arab RepublicTajikistanTanzaniaThailandTimor-LesteTogoTongaTrinidad and TobagoTunisiaTurkeyTurkmenistanTuvaluUgandaUkraineUnited Arab EmiratesUnited KingdomUnited StatesUpper middle incomeUruguayUzbekistanVanuatuVenezuela, RBVietnamWest Bank and GazaWorldYemen, Rep.ZambiaZimbabwe Timeline:
This timeline shows a graph from 1972 to 2016 of Ghana. No data until 1971. Number of actual observations by date: 36.
Source name:
World Development Indicators
Source organization:
UNESCO Institute for Statistics
Categories, topics:
Education
Last updated:
apr 23, 2017
Indicators value changes by year
Minimum:
35.285
jan 1, 1990
Maximum:
71.036
jan 1, 2016
At the date of observation
Value
Absolute change
Change from previous value
jan 1, 1972
43.092
+43.092
0.0%
jan 1, 1974
40.287
-2.805
-6.51%
jan 1, 1975
37.779
-2.508
-6.22%
jan 1, 1976
36.499
-1.28
-3.39%
jan 1, 1977
36.512
+0.013
0.04%
jan 1, 1978
36.893
+0.381
1.04%
jan 1, 1979
36.974
+0.081
0.22%
jan 1, 1980
37.404
+0.43
1.16%
jan 1, 1981
39.153
+1.749
4.68%
jan 1, 1982
39.889
+0.736
1.88%
jan 1, 1983
38.73
-1.158
-2.9%
jan 1, 1984
39.187
+0.456
1.18%
jan 1, 1985
38.991
-0.196
-0.5%
jan 1, 1986
37.47
-1.522
-3.9%
jan 1, 1987
37.607
+0.137
0.37%
jan 1, 1988
37.379
-0.228
-0.61%
jan 1, 1989
39.382
+2.003
5.36%
jan 1, 1990
35.285
-4.097
-10.4%
jan 1, 1991
35.947
+0.663
1.88%
jan 1, 1996
35.84
-0.108
-0.3%
jan 1, 2000
40.739
+4.9
13.67%
jan 1, 2001
41.037
+0.297
0.73%
jan 1, 2002
39.032
-2.005
-4.89%
jan 1, 2003
41.024
+1.992
5.1%
jan 1, 2004
42.389
+1.365
3.33%
jan 1, 2005
45.166
+2.777
6.55%
jan 1, 2006
47.34
+2.174
4.81%
jan 1, 2007
49.048
+1.708
3.61%
jan 1, 2008
53.431
+4.382
8.93%
jan 1, 2009
55.78
+2.349
4.4%
jan 1, 2010
58.294
+2.515
4.51%
jan 1, 2012
57.083
-1.211
-2.08%
jan 1, 2013
58.139
+1.056
1.85%
jan 1, 2014
61.084
+2.945
5.07%
jan 1, 2015
67.096
+6.012
9.84%
jan 1, 2016
71.036
+3.941
5.87%
Ranking of countries by current statistics by years


Comments: