29
/
en
AIzaSyAYiBZKx7MnpbEhh9jyipgxe19OcubqV5w
April 1, 2024
101142
Canada
CAN
true
2
1
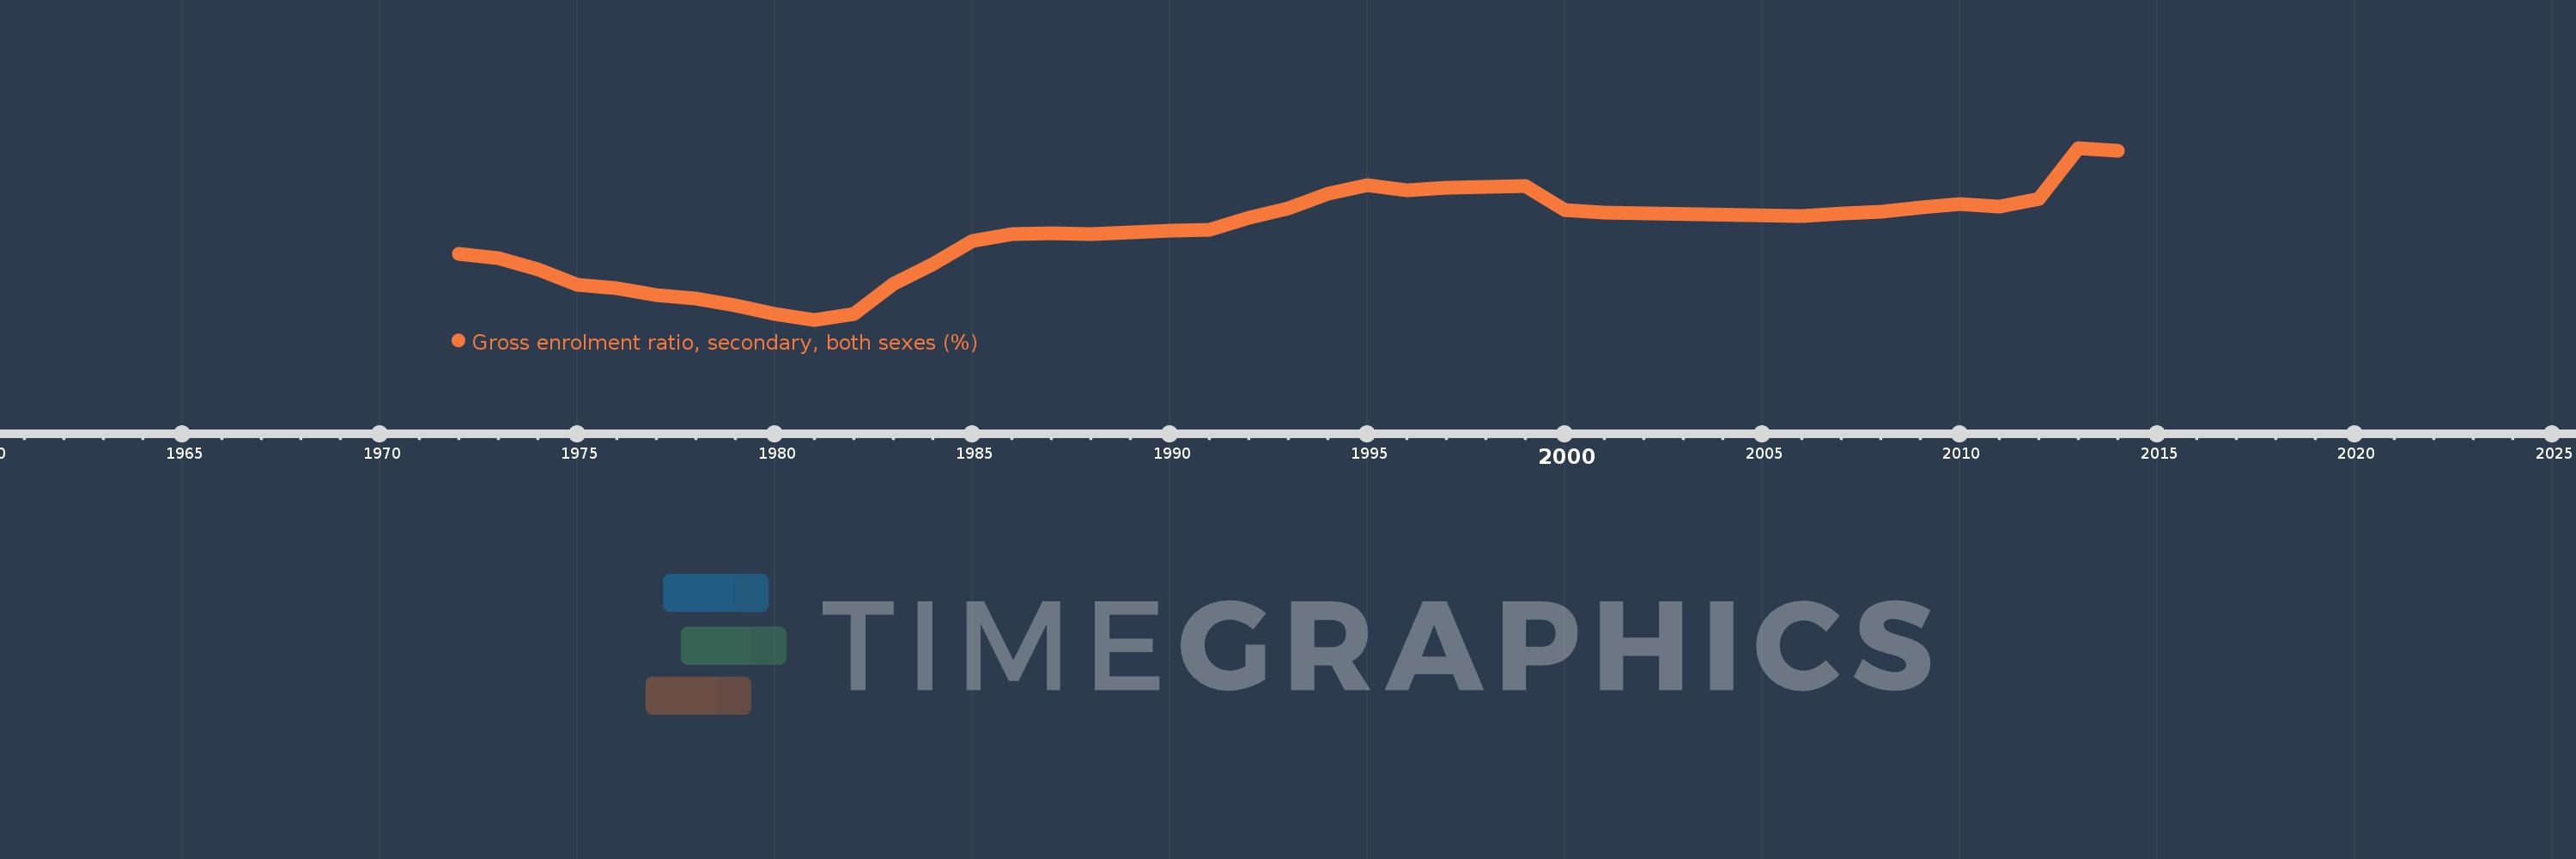
Gross enrolment ratio, secondary, both sexes (%)
2014,2013,2012,2011,2010,2009,2008,2007,2006,2001,2000,1999,1997,1996,1995,1994,1993,1992,1991,1990,1989,1988,1987,1986,1985,1984,1983,1982,1981,1980,1979,1978,1977,1976,1975,1974,1973,1972
This statistics in other country:
AfghanistanAlbaniaAlgeriaAndorraAngolaAntigua and BarbudaArab WorldArgentinaArmeniaArubaAustraliaAustriaAzerbaijanBahamas, TheBahrainBangladeshBarbadosBelarusBelgiumBelizeBeninBermudaBhutanBoliviaBosnia and HerzegovinaBotswanaBrazilBritish Virgin IslandsBrunei DarussalamBulgariaBurkina FasoBurundiCabo VerdeCambodiaCameroonCanadaCaribbean small statesCentral African RepublicCentral Europe and the BalticsChadChileChinaColombiaComorosCongo, Dem. Rep.Congo, Rep.Costa RicaCote d'IvoireCroatiaCubaCuracaoCyprusCzech RepublicDenmarkDjiboutiDominicaDominican RepublicEarly-demographic dividendEast Asia & PacificEast Asia & Pacific (excluding high income)East Asia & Pacific (IDA & IBRD countries)EcuadorEgypt, Arab Rep.El SalvadorEquatorial GuineaEritreaEstoniaEthiopiaEuro areaEurope & Central AsiaEurope & Central Asia (excluding high income)Europe & Central Asia (IDA & IBRD countries)European UnionFijiFinlandFragile and conflict affected situationsFranceGabonGambia, TheGeorgiaGermanyGhanaGreeceGrenadaGuatemalaGuineaGuinea-BissauGuyanaHaitiHeavily indebted poor countries (HIPC)High incomeHondurasHong Kong SAR, ChinaHungaryIBRD onlyIcelandIDA & IBRD totalIDA blendIDA onlyIDA totalIndiaIndonesiaIran, Islamic Rep.IraqIrelandIsraelItalyJamaicaJapanJordanKazakhstanKenyaKiribatiKorea, Dem. People’s Rep.Korea, Rep.KuwaitKyrgyz RepublicLao PDRLate-demographic dividendLatin America & Caribbean Latin America & Caribbean (excluding high income)Latin America & the Caribbean (IDA & IBRD countries)LatviaLeast developed countries: UN classificationLebanonLesothoLiberiaLibyaLiechtensteinLithuaniaLow & middle incomeLow incomeLower middle incomeLuxembourgMacao SAR, ChinaMacedonia, FYRMadagascarMalawiMalaysiaMaldivesMaliMaltaMarshall IslandsMauritaniaMauritiusMexicoMicronesia, Fed. Sts.Middle East & North AfricaMiddle East & North Africa (excluding high income)Middle East & North Africa (IDA & IBRD countries)Middle incomeMoldovaMongoliaMontenegroMoroccoMozambiqueMyanmarNamibiaNauruNepalNetherlandsNew ZealandNicaraguaNigerNigeriaNorth AmericaNorwayOECD membersOmanOther small statesPacific island small statesPakistanPalauPanamaPapua New GuineaParaguayPeruPhilippinesPolandPortugalPost-demographic dividendPre-demographic dividendPuerto RicoQatarRomaniaRussian FederationRwandaSamoaSan MarinoSao Tome and PrincipeSaudi ArabiaSenegalSerbiaSeychellesSierra LeoneSlovak RepublicSloveniaSmall statesSolomon IslandsSomaliaSouth AfricaSouth AsiaSouth Asia (IDA & IBRD)SpainSri LankaSt. Kitts and NevisSt. LuciaSt. Vincent and the GrenadinesSub-Saharan Africa Sub-Saharan Africa (excluding high income)Sub-Saharan Africa (IDA & IBRD countries)SudanSurinameSwazilandSwedenSwitzerlandSyrian Arab RepublicTajikistanTanzaniaThailandTimor-LesteTogoTongaTrinidad and TobagoTunisiaTurkeyTurkmenistanTuvaluUgandaUkraineUnited Arab EmiratesUnited KingdomUnited StatesUpper middle incomeUruguayUzbekistanVanuatuVenezuela, RBVietnamWest Bank and GazaWorldYemen, Rep.ZambiaZimbabwe Timeline:
This timeline shows a graph from 1972 to 2014 of Canada. No data until 1971. Number of actual observations by date: 38.
Source name:
World Development Indicators
Source organization:
UNESCO Institute for Statistics
Categories, topics:
Education
Last updated:
apr 23, 2017
Indicators value changes by year
Maximum:
110.268
jan 1, 2013
At the date of observation
Value
Absolute change
Change from previous value
jan 1, 1972
95.988
+95.988
0.0%
jan 1, 1973
95.44
-0.547
-0.57%
jan 1, 1974
93.925
-1.516
-1.59%
jan 1, 1975
91.887
-2.038
-2.17%
jan 1, 1976
91.417
-0.47
-0.51%
jan 1, 1977
90.431
-0.985
-1.08%
jan 1, 1978
90.035
-0.396
-0.44%
jan 1, 1979
89.051
-0.984
-1.09%
jan 1, 1980
87.933
-1.119
-1.26%
jan 1, 1981
87.12
-0.812
-0.92%
jan 1, 1982
87.921
+0.801
0.92%
jan 1, 1983
91.965
+4.044
4.6%
jan 1, 1984
94.591
+2.626
2.86%
jan 1, 1985
97.69
+3.099
3.28%
jan 1, 1986
98.676
+0.986
1.01%
jan 1, 1987
98.748
+0.072
0.07%
jan 1, 1988
98.647
-0.102
-0.1%
jan 1, 1989
98.896
+0.249
0.25%
jan 1, 1990
99.134
+0.239
0.24%
jan 1, 1991
99.289
+0.155
0.16%
jan 1, 1992
100.882
+1.593
1.6%
jan 1, 1993
102.177
+1.295
1.28%
jan 1, 1994
104.057
+1.88
1.84%
jan 1, 1995
105.21
+1.152
1.11%
jan 1, 1996
104.601
-0.609
-0.58%
jan 1, 1997
104.929
+0.328
0.31%
jan 1, 1999
105.122
+0.192
0.18%
jan 1, 2000
101.944
-3.178
-3.02%
jan 1, 2001
101.52
-0.424
-0.42%
jan 1, 2006
101.057
-0.463
-0.46%
jan 1, 2007
101.425
+0.368
0.36%
jan 1, 2008
101.678
+0.253
0.25%
jan 1, 2009
102.197
+0.519
0.51%
jan 1, 2010
102.663
+0.466
0.46%
jan 1, 2011
102.397
-0.266
-0.26%
jan 1, 2012
103.411
+1.014
0.99%
jan 1, 2013
110.268
+6.856
6.63%
jan 1, 2014
109.932
-0.336
-0.3%
Ranking of countries by current statistics by years


Comments: