29
/
en
AIzaSyAYiBZKx7MnpbEhh9jyipgxe19OcubqV5w
April 1, 2024
72789
Australia
AUS
true
2
1
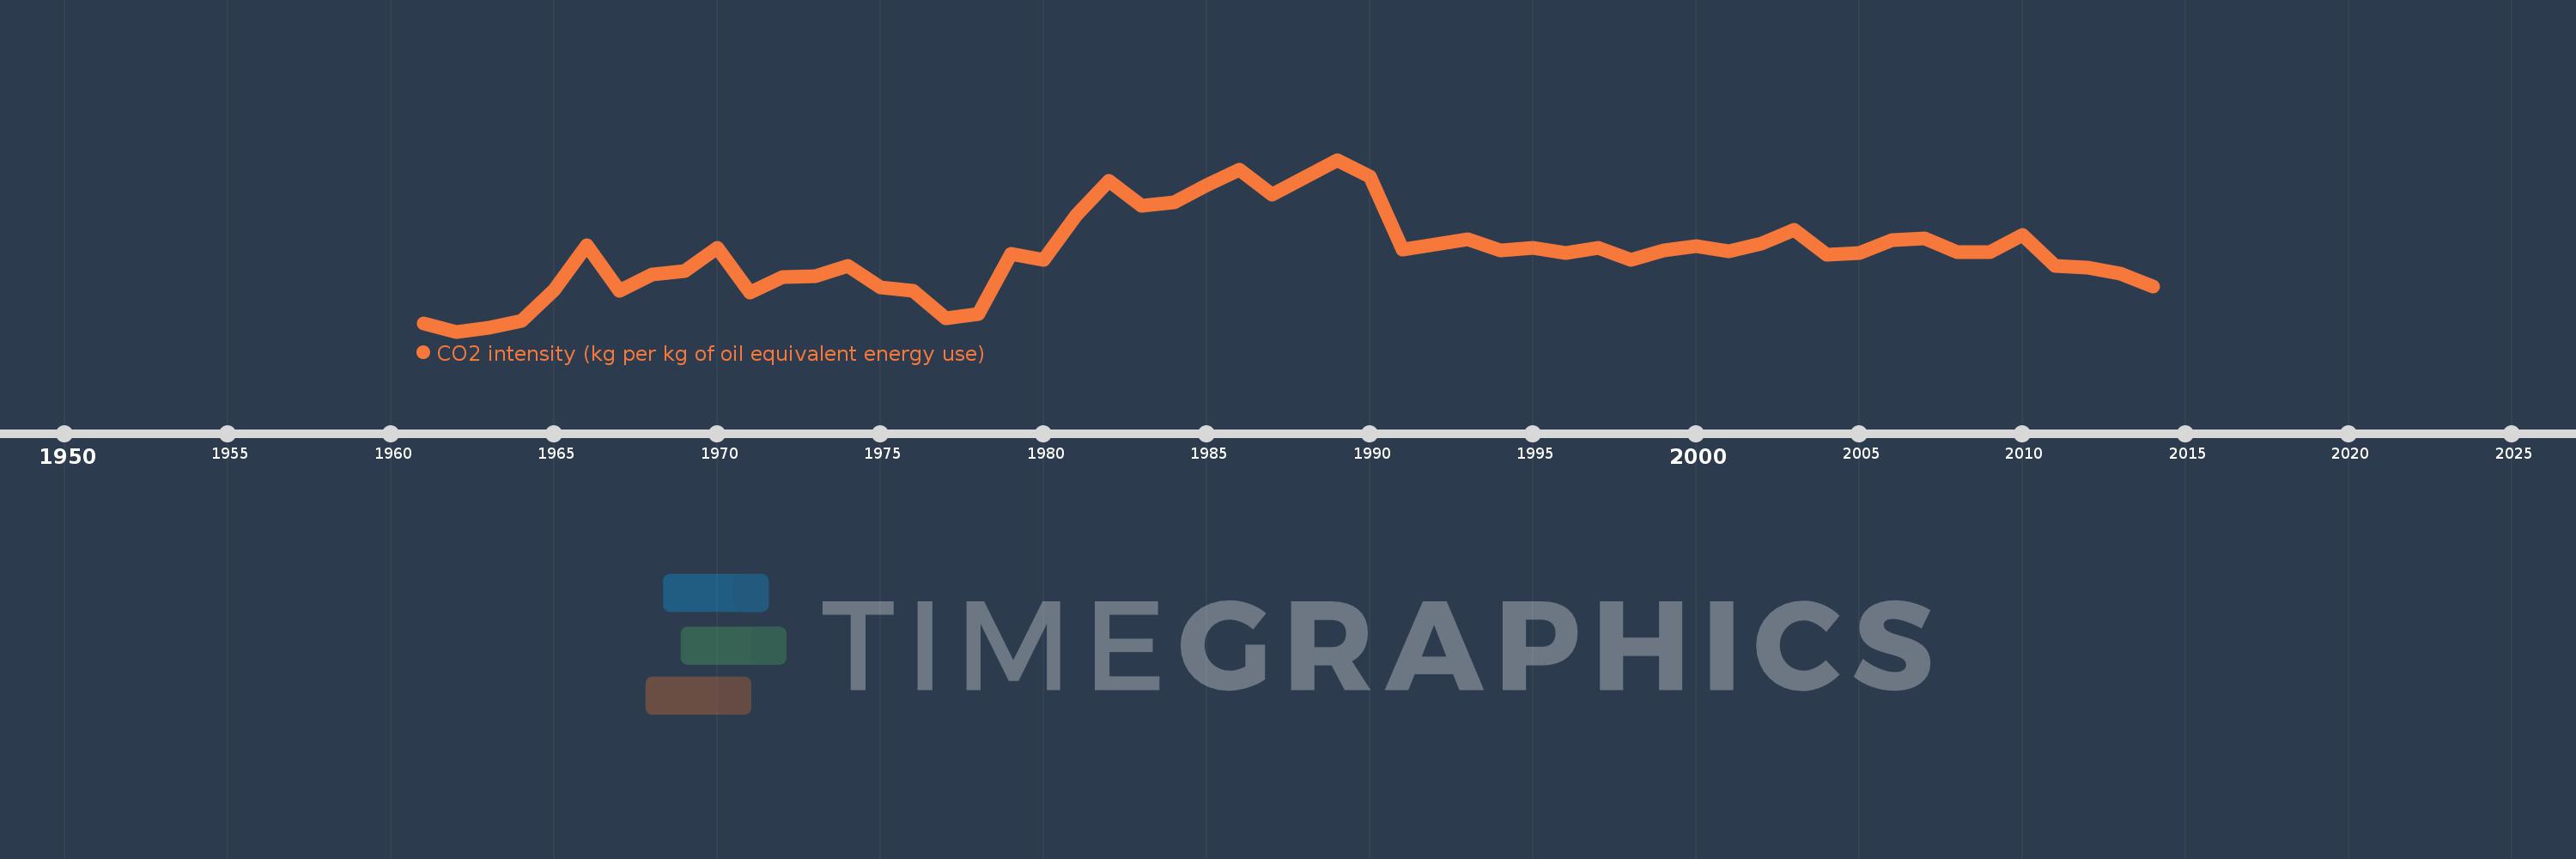
CO2 intensity (kg per kg of oil equivalent energy use)
2014,2013,2012,2011,2010,2009,2008,2007,2006,2005,2004,2003,2002,2001,2000,1999,1998,1997,1996,1995,1994,1993,1992,1991,1990,1989,1988,1987,1986,1985,1984,1983,1982,1981,1980,1979,1978,1977,1976,1975,1974,1973,1972,1971,1970,1969,1968,1967,1966,1965,1964,1963,1962,1961
This statistics in other country:
AlbaniaAlgeriaAngolaAntigua and BarbudaArab WorldArgentinaArmeniaAustraliaAustriaAzerbaijanBahamas, TheBahrainBangladeshBarbadosBelarusBelgiumBelizeBeninBhutanBoliviaBosnia and HerzegovinaBotswanaBrazilBrunei DarussalamBulgariaCabo VerdeCambodiaCameroonCanadaCaribbean small statesCentral Europe and the BalticsChileChinaColombiaComorosCongo, Dem. Rep.Congo, Rep.Costa RicaCote d'IvoireCroatiaCubaCuracaoCyprusCzech RepublicDenmarkDjiboutiDominicaDominican RepublicEarly-demographic dividendEast Asia & PacificEast Asia & Pacific (excluding high income)East Asia & Pacific (IDA & IBRD countries)EcuadorEgypt, Arab Rep.El SalvadorEquatorial GuineaEritreaEstoniaEthiopiaEuro areaEurope & Central AsiaEurope & Central Asia (excluding high income)Europe & Central Asia (IDA & IBRD countries)European UnionFijiFinlandFragile and conflict affected situationsFranceGabonGambia, TheGeorgiaGermanyGhanaGibraltarGreeceGrenadaGuatemalaGuinea-BissauGuyanaHaitiHeavily indebted poor countries (HIPC)High incomeHondurasHong Kong SAR, ChinaHungaryIBRD onlyIcelandIDA & IBRD totalIDA blendIDA onlyIDA totalIndiaIndonesiaIran, Islamic Rep.IraqIrelandIsraelItalyJamaicaJapanJordanKazakhstanKenyaKiribatiKorea, Dem. People’s Rep.Korea, Rep.KuwaitKyrgyz RepublicLate-demographic dividendLatin America & Caribbean Latin America & Caribbean (excluding high income)Latin America & the Caribbean (IDA & IBRD countries)LatviaLeast developed countries: UN classificationLebanonLesothoLibyaLithuaniaLow & middle incomeLow incomeLower middle incomeLuxembourgMacedonia, FYRMalaysiaMaldivesMaltaMarshall IslandsMauritiusMexicoMiddle East & North AfricaMiddle East & North Africa (excluding high income)Middle East & North Africa (IDA & IBRD countries)Middle incomeMoldovaMongoliaMontenegroMoroccoMozambiqueMyanmarNamibiaNepalNetherlandsNew ZealandNicaraguaNigerNigeriaNorth AmericaNorwayOECD membersOmanOther small statesPacific island small statesPakistanPalauPanamaParaguayPeruPhilippinesPolandPortugalPost-demographic dividendPre-demographic dividendQatarRomaniaRussian FederationSamoaSao Tome and PrincipeSaudi ArabiaSenegalSerbiaSeychellesSingaporeSlovak RepublicSloveniaSmall statesSolomon IslandsSouth AfricaSouth AsiaSouth Asia (IDA & IBRD)South SudanSpainSri LankaSt. Kitts and NevisSt. LuciaSt. Vincent and the GrenadinesSub-Saharan Africa Sub-Saharan Africa (excluding high income)Sub-Saharan Africa (IDA & IBRD countries)SudanSurinameSwazilandSwedenSwitzerlandSyrian Arab RepublicTajikistanTanzaniaThailandTimor-LesteTogoTongaTrinidad and TobagoTunisiaTurkeyTurkmenistanUkraineUnited Arab EmiratesUnited KingdomUnited StatesUpper middle incomeUruguayUzbekistanVanuatuVenezuela, RBVietnamWorldYemen, Rep.ZambiaZimbabwe Timeline:
This timeline shows a graph from 1961 to 2014 of Australia. No data until 1960. Number of actual observations by date: 54.
Source name:
World Development Indicators
Source organization:
Carbon Dioxide Information Analysis Center, Environmental Sciences Division, Oak Ridge National Laboratory, Tennessee, United States.
Categories, topics:
Climate Change, Environment
Last updated:
apr 23, 2017
Indicators value changes by year
At the date of observation
Value
Absolute change
Change from previous value
jan 1, 1961
2.802
+2.802
0.0%
jan 1, 1962
2.773
-0.028
-1.0%
jan 1, 1963
2.785
+0.011
0.4%
jan 1, 1964
2.809
+0.025
0.89%
jan 1, 1965
2.914
+0.104
3.71%
jan 1, 1966
3.067
+0.154
5.27%
jan 1, 1967
2.912
-0.155
-5.05%
jan 1, 1968
2.967
+0.055
1.87%
jan 1, 1969
2.979
+0.012
0.4%
jan 1, 1970
3.058
+0.08
2.68%
jan 1, 1971
2.905
-0.154
-5.03%
jan 1, 1972
2.96
+0.055
1.9%
jan 1, 1973
2.962
+0.002
0.06%
jan 1, 1974
2.997
+0.035
1.18%
jan 1, 1975
2.925
-0.072
-2.41%
jan 1, 1976
2.913
-0.012
-0.4%
jan 1, 1977
2.818
-0.095
-3.25%
jan 1, 1978
2.833
+0.014
0.51%
jan 1, 1979
3.039
+0.206
7.29%
jan 1, 1980
3.017
-0.023
-0.74%
jan 1, 1981
3.171
+0.155
5.14%
jan 1, 1982
3.287
+0.116
3.65%
jan 1, 1983
3.202
-0.085
-2.6%
jan 1, 1984
3.214
+0.012
0.38%
jan 1, 1985
3.272
+0.058
1.81%
jan 1, 1986
3.326
+0.054
1.64%
jan 1, 1987
3.24
-0.086
-2.58%
jan 1, 1988
3.3
+0.06
1.84%
jan 1, 1989
3.359
+0.059
1.8%
jan 1, 1990
3.303
-0.056
-1.66%
jan 1, 1991
3.053
-0.25
-7.58%
jan 1, 1992
3.07
+0.017
0.55%
jan 1, 1993
3.089
+0.019
0.61%
jan 1, 1994
3.05
-0.038
-1.25%
jan 1, 1995
3.06
+0.01
0.33%
jan 1, 1996
3.041
-0.02
-0.64%
jan 1, 1997
3.06
+0.019
0.62%
jan 1, 1998
3.019
-0.04
-1.32%
jan 1, 1999
3.049
+0.03
1.0%
jan 1, 2000
3.064
+0.015
0.48%
jan 1, 2001
3.048
-0.016
-0.54%
jan 1, 2002
3.072
+0.024
0.8%
jan 1, 2003
3.119
+0.047
1.52%
jan 1, 2004
3.035
-0.084
-2.68%
jan 1, 2005
3.041
+0.006
0.21%
jan 1, 2006
3.086
+0.044
1.46%
jan 1, 2007
3.092
+0.006
0.19%
jan 1, 2008
3.044
-0.047
-1.53%
jan 1, 2009
3.045
+0.0
0.01%
jan 1, 2010
3.104
+0.06
1.96%
jan 1, 2011
2.996
-0.109
-3.51%
jan 1, 2012
2.991
-0.005
-0.16%
jan 1, 2013
2.972
-0.019
-0.63%
jan 1, 2014
2.926
-0.046
-1.53%
Ranking of countries by current statistics by years


Comments: