29
/
en
AIzaSyAYiBZKx7MnpbEhh9jyipgxe19OcubqV5w
April 1, 2024
106996
Colombia
COL
true
2
1
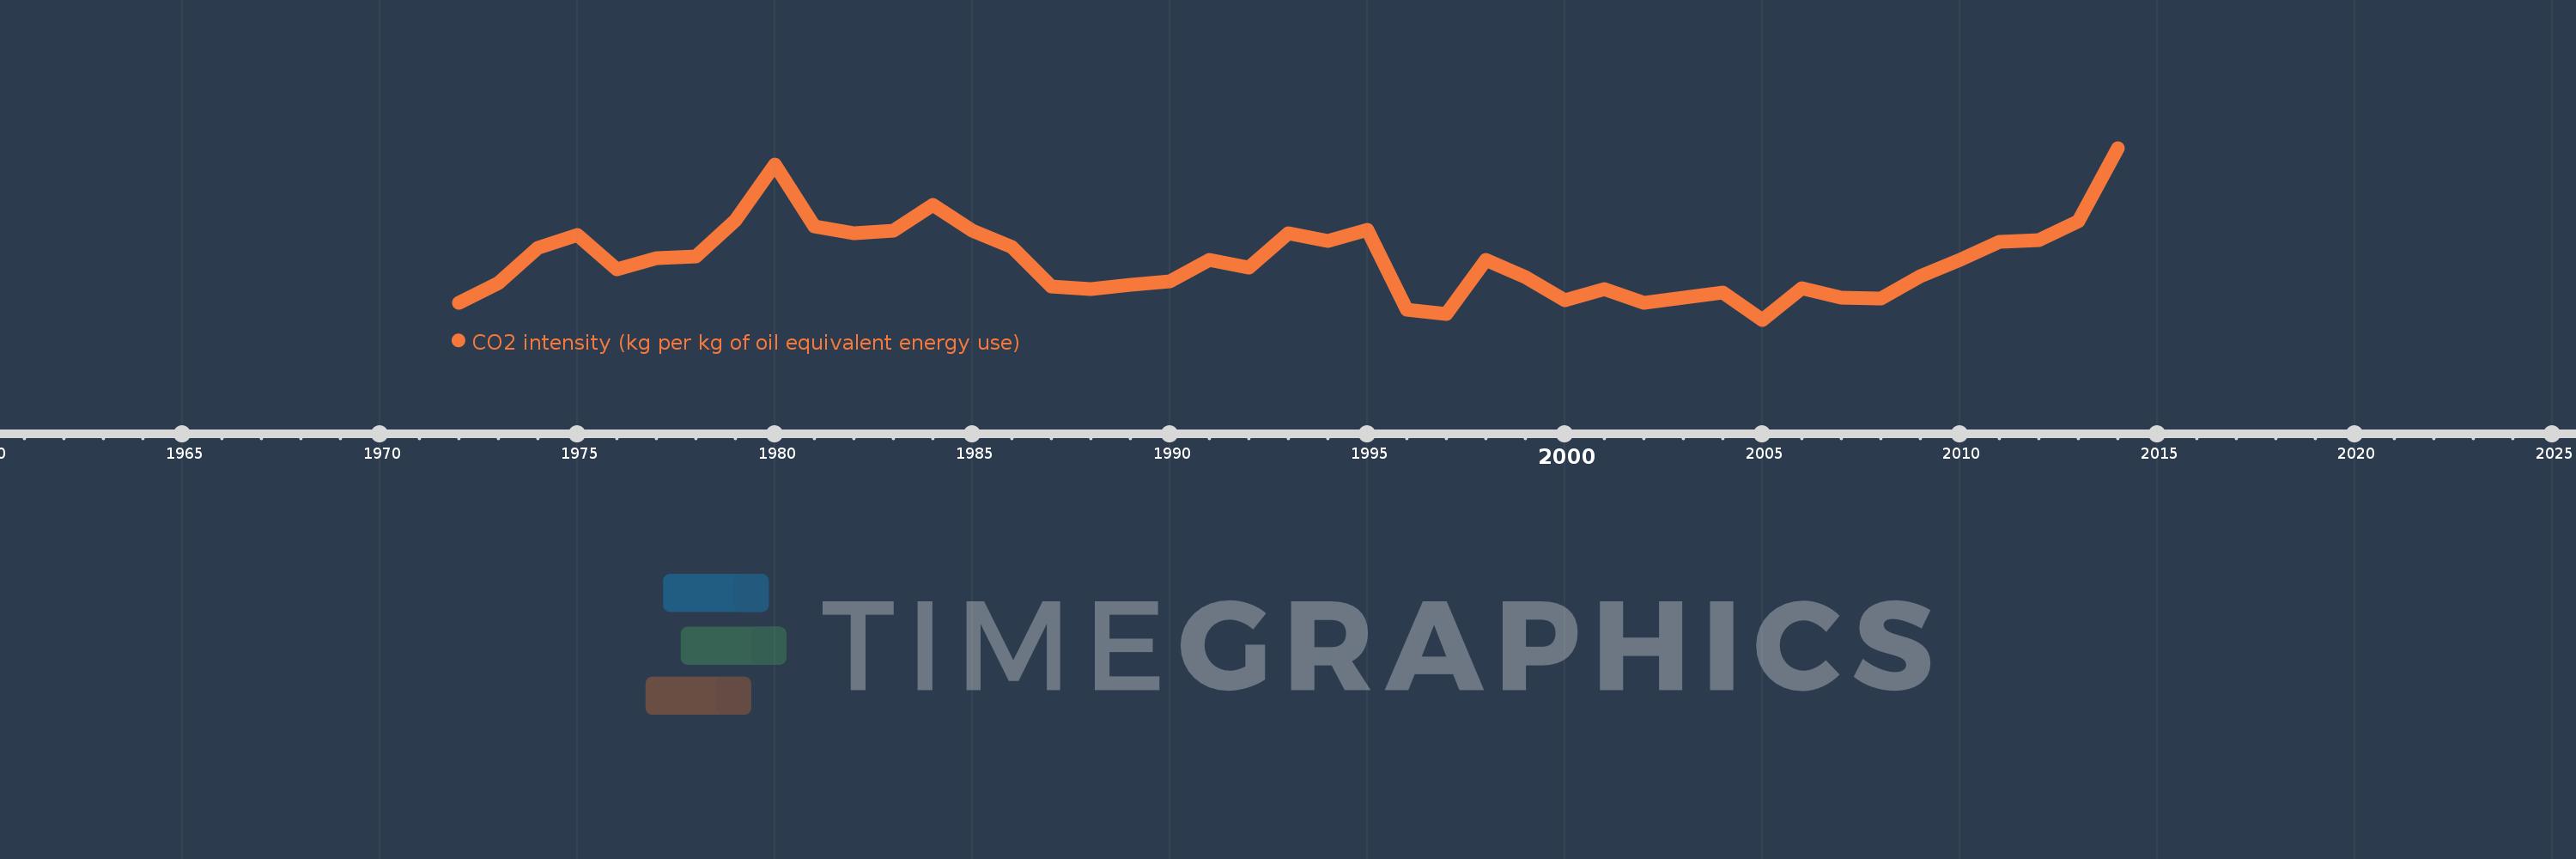
CO2 intensity (kg per kg of oil equivalent energy use)
2014,2013,2012,2011,2010,2009,2008,2007,2006,2005,2004,2003,2002,2001,2000,1999,1998,1997,1996,1995,1994,1993,1992,1991,1990,1989,1988,1987,1986,1985,1984,1983,1982,1981,1980,1979,1978,1977,1976,1975,1974,1973,1972
This statistics in other country:
AlbaniaAlgeriaAngolaAntigua and BarbudaArab WorldArgentinaArmeniaAustraliaAustriaAzerbaijanBahamas, TheBahrainBangladeshBarbadosBelarusBelgiumBelizeBeninBhutanBoliviaBosnia and HerzegovinaBotswanaBrazilBrunei DarussalamBulgariaCabo VerdeCambodiaCameroonCanadaCaribbean small statesCentral Europe and the BalticsChileChinaColombiaComorosCongo, Dem. Rep.Congo, Rep.Costa RicaCote d'IvoireCroatiaCubaCuracaoCyprusCzech RepublicDenmarkDjiboutiDominicaDominican RepublicEarly-demographic dividendEast Asia & PacificEast Asia & Pacific (excluding high income)East Asia & Pacific (IDA & IBRD countries)EcuadorEgypt, Arab Rep.El SalvadorEquatorial GuineaEritreaEstoniaEthiopiaEuro areaEurope & Central AsiaEurope & Central Asia (excluding high income)Europe & Central Asia (IDA & IBRD countries)European UnionFijiFinlandFragile and conflict affected situationsFranceGabonGambia, TheGeorgiaGermanyGhanaGibraltarGreeceGrenadaGuatemalaGuinea-BissauGuyanaHaitiHeavily indebted poor countries (HIPC)High incomeHondurasHong Kong SAR, ChinaHungaryIBRD onlyIcelandIDA & IBRD totalIDA blendIDA onlyIDA totalIndiaIndonesiaIran, Islamic Rep.IraqIrelandIsraelItalyJamaicaJapanJordanKazakhstanKenyaKiribatiKorea, Dem. People’s Rep.Korea, Rep.KuwaitKyrgyz RepublicLate-demographic dividendLatin America & Caribbean Latin America & Caribbean (excluding high income)Latin America & the Caribbean (IDA & IBRD countries)LatviaLeast developed countries: UN classificationLebanonLesothoLibyaLithuaniaLow & middle incomeLow incomeLower middle incomeLuxembourgMacedonia, FYRMalaysiaMaldivesMaltaMarshall IslandsMauritiusMexicoMiddle East & North AfricaMiddle East & North Africa (excluding high income)Middle East & North Africa (IDA & IBRD countries)Middle incomeMoldovaMongoliaMontenegroMoroccoMozambiqueMyanmarNamibiaNepalNetherlandsNew ZealandNicaraguaNigerNigeriaNorth AmericaNorwayOECD membersOmanOther small statesPacific island small statesPakistanPalauPanamaParaguayPeruPhilippinesPolandPortugalPost-demographic dividendPre-demographic dividendQatarRomaniaRussian FederationSamoaSao Tome and PrincipeSaudi ArabiaSenegalSerbiaSeychellesSingaporeSlovak RepublicSloveniaSmall statesSolomon IslandsSouth AfricaSouth AsiaSouth Asia (IDA & IBRD)South SudanSpainSri LankaSt. Kitts and NevisSt. LuciaSt. Vincent and the GrenadinesSub-Saharan Africa Sub-Saharan Africa (excluding high income)Sub-Saharan Africa (IDA & IBRD countries)SudanSurinameSwazilandSwedenSwitzerlandSyrian Arab RepublicTajikistanTanzaniaThailandTimor-LesteTogoTongaTrinidad and TobagoTunisiaTurkeyTurkmenistanUkraineUnited Arab EmiratesUnited KingdomUnited StatesUpper middle incomeUruguayUzbekistanVanuatuVenezuela, RBVietnamWorldYemen, Rep.ZambiaZimbabwe Timeline:
This timeline shows a graph from 1972 to 2014 of Colombia. No data until 1971. Number of actual observations by date: 43.
Source name:
World Development Indicators
Source organization:
Carbon Dioxide Information Analysis Center, Environmental Sciences Division, Oak Ridge National Laboratory, Tennessee, United States.
Categories, topics:
Climate Change, Environment
Last updated:
apr 23, 2017
Indicators value changes by year
At the date of observation
Value
Absolute change
Change from previous value
jan 1, 1972
2.189
+2.189
0.0%
jan 1, 1973
2.271
+0.081
3.71%
jan 1, 1974
2.416
+0.146
6.42%
jan 1, 1975
2.47
+0.053
2.21%
jan 1, 1976
2.326
-0.144
-5.84%
jan 1, 1977
2.373
+0.048
2.05%
jan 1, 1978
2.381
+0.008
0.33%
jan 1, 1979
2.532
+0.151
6.35%
jan 1, 1980
2.764
+0.232
9.17%
jan 1, 1981
2.505
-0.259
-9.38%
jan 1, 1982
2.479
-0.026
-1.05%
jan 1, 1983
2.489
+0.01
0.42%
jan 1, 1984
2.596
+0.107
4.29%
jan 1, 1985
2.488
-0.108
-4.17%
jan 1, 1986
2.42
-0.068
-2.72%
jan 1, 1987
2.256
-0.164
-6.78%
jan 1, 1988
2.244
-0.012
-0.54%
jan 1, 1989
2.263
+0.019
0.83%
jan 1, 1990
2.278
+0.016
0.69%
jan 1, 1991
2.367
+0.089
3.91%
jan 1, 1992
2.333
-0.034
-1.45%
jan 1, 1993
2.477
+0.145
6.2%
jan 1, 1994
2.444
-0.034
-1.36%
jan 1, 1995
2.491
+0.048
1.95%
jan 1, 1996
2.16
-0.331
-13.29%
jan 1, 1997
2.141
-0.019
-0.89%
jan 1, 1998
2.366
+0.225
10.53%
jan 1, 1999
2.297
-0.07
-2.94%
jan 1, 2000
2.2
-0.097
-4.22%
jan 1, 2001
2.244
+0.044
2.01%
jan 1, 2002
2.189
-0.055
-2.45%
jan 1, 2003
2.208
+0.019
0.89%
jan 1, 2004
2.231
+0.023
1.04%
jan 1, 2005
2.118
-0.113
-5.07%
jan 1, 2006
2.25
+0.132
6.23%
jan 1, 2007
2.211
-0.039
-1.74%
jan 1, 2008
2.207
-0.004
-0.19%
jan 1, 2009
2.299
+0.092
4.17%
jan 1, 2010
2.367
+0.068
2.94%
jan 1, 2011
2.441
+0.074
3.14%
jan 1, 2012
2.449
+0.008
0.32%
jan 1, 2013
2.528
+0.08
3.25%
jan 1, 2014
2.832
+0.303
12.0%
Ranking of countries by current statistics by years


Comments: