29
/
en
AIzaSyAYiBZKx7MnpbEhh9jyipgxe19OcubqV5w
April 1, 2024
73727
Austria
AUT
true
2
1
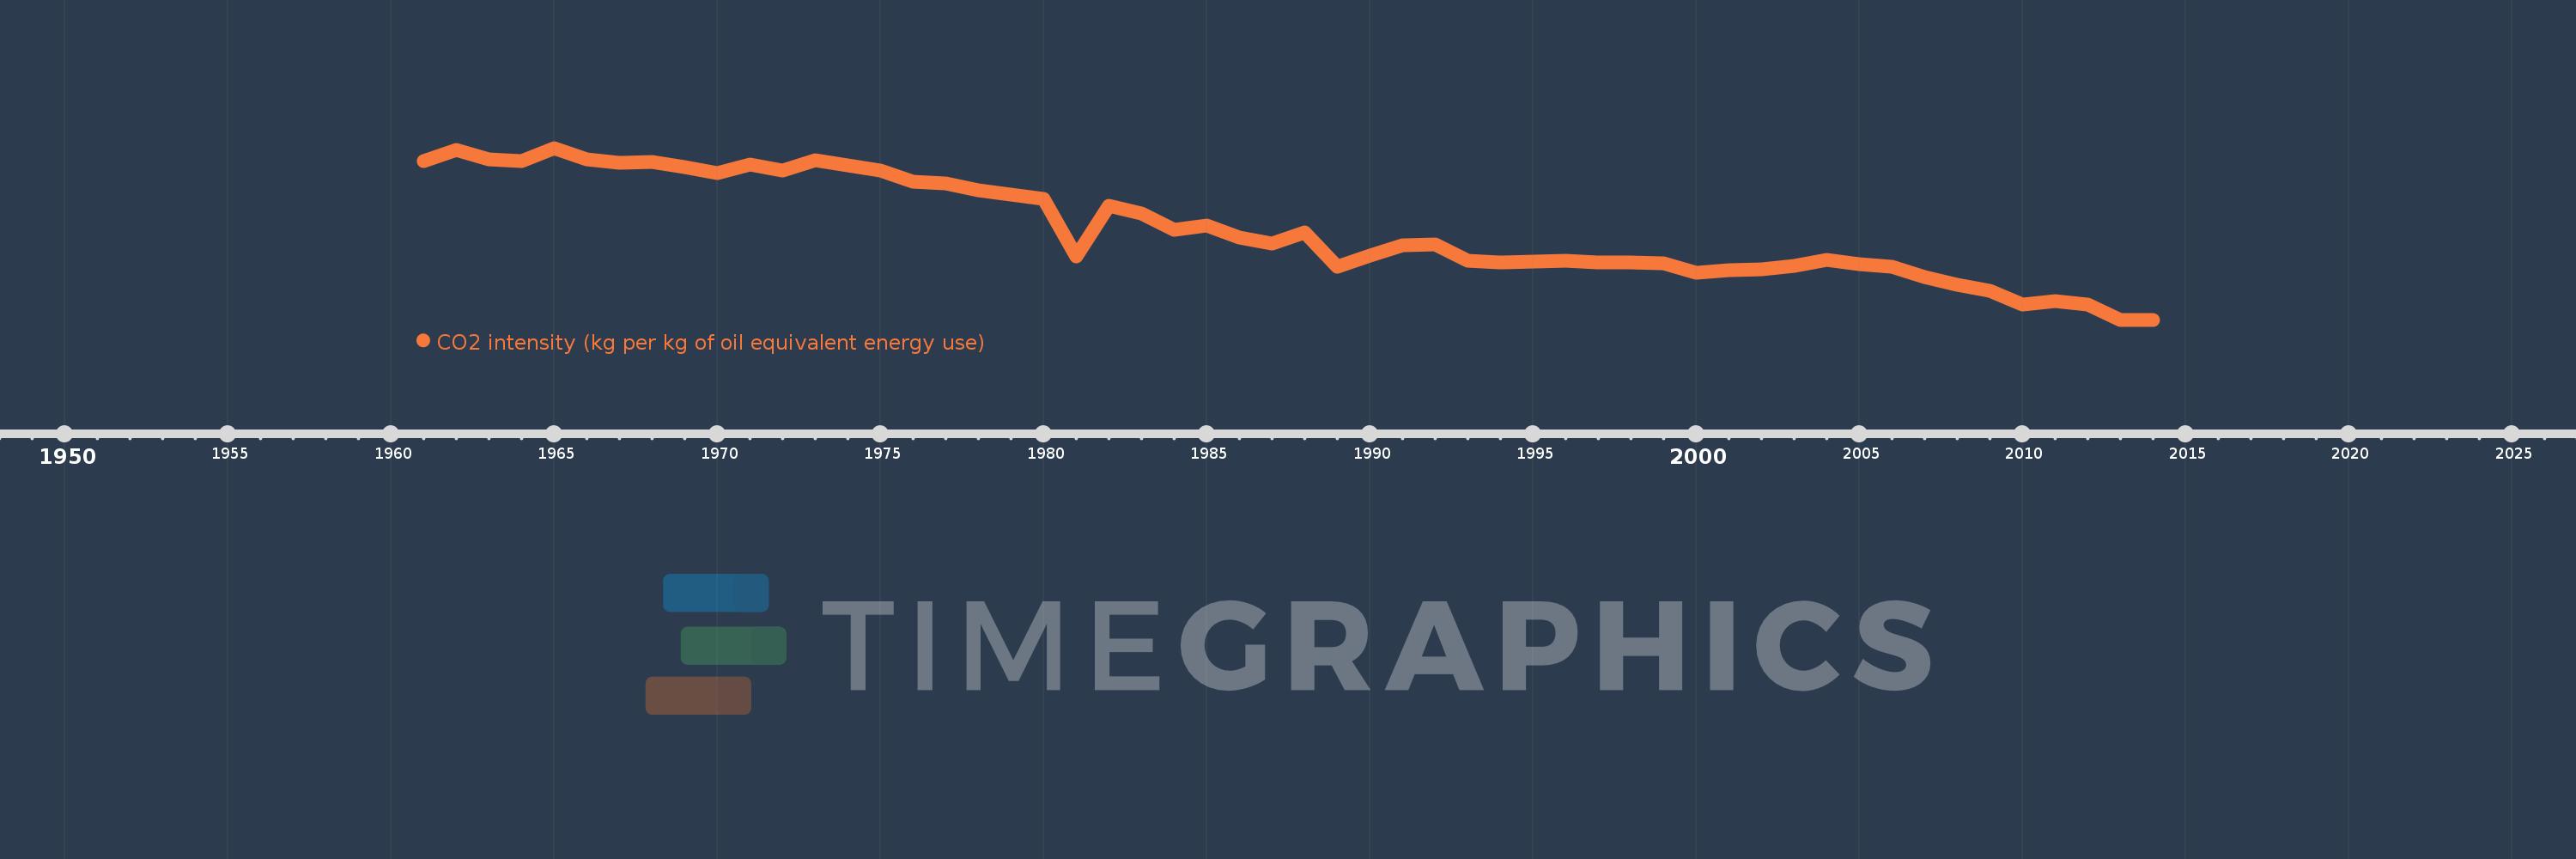
CO2 intensity (kg per kg of oil equivalent energy use)
2014,2013,2012,2011,2010,2009,2008,2007,2006,2005,2004,2003,2002,2001,2000,1999,1998,1997,1996,1995,1994,1993,1992,1991,1990,1989,1988,1987,1986,1985,1984,1983,1982,1981,1980,1979,1978,1977,1976,1975,1974,1973,1972,1971,1970,1969,1968,1967,1966,1965,1964,1963,1962,1961
This statistics in other country:
AlbaniaAlgeriaAngolaAntigua and BarbudaArab WorldArgentinaArmeniaAustraliaAustriaAzerbaijanBahamas, TheBahrainBangladeshBarbadosBelarusBelgiumBelizeBeninBhutanBoliviaBosnia and HerzegovinaBotswanaBrazilBrunei DarussalamBulgariaCabo VerdeCambodiaCameroonCanadaCaribbean small statesCentral Europe and the BalticsChileChinaColombiaComorosCongo, Dem. Rep.Congo, Rep.Costa RicaCote d'IvoireCroatiaCubaCuracaoCyprusCzech RepublicDenmarkDjiboutiDominicaDominican RepublicEarly-demographic dividendEast Asia & PacificEast Asia & Pacific (excluding high income)East Asia & Pacific (IDA & IBRD countries)EcuadorEgypt, Arab Rep.El SalvadorEquatorial GuineaEritreaEstoniaEthiopiaEuro areaEurope & Central AsiaEurope & Central Asia (excluding high income)Europe & Central Asia (IDA & IBRD countries)European UnionFijiFinlandFragile and conflict affected situationsFranceGabonGambia, TheGeorgiaGermanyGhanaGibraltarGreeceGrenadaGuatemalaGuinea-BissauGuyanaHaitiHeavily indebted poor countries (HIPC)High incomeHondurasHong Kong SAR, ChinaHungaryIBRD onlyIcelandIDA & IBRD totalIDA blendIDA onlyIDA totalIndiaIndonesiaIran, Islamic Rep.IraqIrelandIsraelItalyJamaicaJapanJordanKazakhstanKenyaKiribatiKorea, Dem. People’s Rep.Korea, Rep.KuwaitKyrgyz RepublicLate-demographic dividendLatin America & Caribbean Latin America & Caribbean (excluding high income)Latin America & the Caribbean (IDA & IBRD countries)LatviaLeast developed countries: UN classificationLebanonLesothoLibyaLithuaniaLow & middle incomeLow incomeLower middle incomeLuxembourgMacedonia, FYRMalaysiaMaldivesMaltaMarshall IslandsMauritiusMexicoMiddle East & North AfricaMiddle East & North Africa (excluding high income)Middle East & North Africa (IDA & IBRD countries)Middle incomeMoldovaMongoliaMontenegroMoroccoMozambiqueMyanmarNamibiaNepalNetherlandsNew ZealandNicaraguaNigerNigeriaNorth AmericaNorwayOECD membersOmanOther small statesPacific island small statesPakistanPalauPanamaParaguayPeruPhilippinesPolandPortugalPost-demographic dividendPre-demographic dividendQatarRomaniaRussian FederationSamoaSao Tome and PrincipeSaudi ArabiaSenegalSerbiaSeychellesSingaporeSlovak RepublicSloveniaSmall statesSolomon IslandsSouth AfricaSouth AsiaSouth Asia (IDA & IBRD)South SudanSpainSri LankaSt. Kitts and NevisSt. LuciaSt. Vincent and the GrenadinesSub-Saharan Africa Sub-Saharan Africa (excluding high income)Sub-Saharan Africa (IDA & IBRD countries)SudanSurinameSwazilandSwedenSwitzerlandSyrian Arab RepublicTajikistanTanzaniaThailandTimor-LesteTogoTongaTrinidad and TobagoTunisiaTurkeyTurkmenistanUkraineUnited Arab EmiratesUnited KingdomUnited StatesUpper middle incomeUruguayUzbekistanVanuatuVenezuela, RBVietnamWorldYemen, Rep.ZambiaZimbabwe Timeline:
This timeline shows a graph from 1961 to 2014 of Austria. No data until 1960. Number of actual observations by date: 54.
Source name:
World Development Indicators
Source organization:
Carbon Dioxide Information Analysis Center, Environmental Sciences Division, Oak Ridge National Laboratory, Tennessee, United States.
Categories, topics:
Climate Change, Environment
Last updated:
apr 23, 2017
Indicators value changes by year
At the date of observation
Value
Absolute change
Change from previous value
jan 1, 1961
2.828
+2.828
0.0%
jan 1, 1962
2.893
+0.065
2.3%
jan 1, 1963
2.838
-0.056
-1.93%
jan 1, 1964
2.826
-0.011
-0.4%
jan 1, 1965
2.906
+0.08
2.82%
jan 1, 1966
2.836
-0.07
-2.4%
jan 1, 1967
2.818
-0.018
-0.65%
jan 1, 1968
2.821
+0.004
0.13%
jan 1, 1969
2.792
-0.03
-1.06%
jan 1, 1970
2.753
-0.038
-1.38%
jan 1, 1971
2.807
+0.054
1.97%
jan 1, 1972
2.772
-0.035
-1.26%
jan 1, 1973
2.835
+0.063
2.27%
jan 1, 1974
2.801
-0.034
-1.18%
jan 1, 1975
2.77
-0.032
-1.13%
jan 1, 1976
2.703
-0.066
-2.4%
jan 1, 1977
2.693
-0.01
-0.37%
jan 1, 1978
2.655
-0.038
-1.41%
jan 1, 1979
2.627
-0.028
-1.05%
jan 1, 1980
2.599
-0.028
-1.07%
jan 1, 1981
2.259
-0.34
-13.09%
jan 1, 1982
2.56
+0.301
13.32%
jan 1, 1983
2.513
-0.047
-1.84%
jan 1, 1984
2.418
-0.095
-3.79%
jan 1, 1985
2.442
+0.025
1.03%
jan 1, 1986
2.37
-0.073
-2.99%
jan 1, 1987
2.334
-0.036
-1.52%
jan 1, 1988
2.401
+0.068
2.9%
jan 1, 1989
2.194
-0.207
-8.62%
jan 1, 1990
2.263
+0.068
3.11%
jan 1, 1991
2.323
+0.061
2.68%
jan 1, 1992
2.331
+0.007
0.32%
jan 1, 1993
2.231
-0.1
-4.28%
jan 1, 1994
2.223
-0.008
-0.35%
jan 1, 1995
2.227
+0.004
0.18%
jan 1, 1996
2.234
+0.007
0.32%
jan 1, 1997
2.222
-0.012
-0.54%
jan 1, 1998
2.22
-0.003
-0.11%
jan 1, 1999
2.218
-0.002
-0.09%
jan 1, 2000
2.161
-0.057
-2.58%
jan 1, 2001
2.177
+0.017
0.77%
jan 1, 2002
2.18
+0.002
0.11%
jan 1, 2003
2.199
+0.019
0.88%
jan 1, 2004
2.237
+0.038
1.74%
jan 1, 2005
2.21
-0.027
-1.22%
jan 1, 2006
2.198
-0.012
-0.54%
jan 1, 2007
2.133
-0.065
-2.96%
jan 1, 2008
2.086
-0.047
-2.2%
jan 1, 2009
2.051
-0.035
-1.68%
jan 1, 2010
1.972
-0.079
-3.83%
jan 1, 2011
1.988
+0.016
0.8%
jan 1, 2012
1.972
-0.016
-0.8%
jan 1, 2013
1.879
-0.093
-4.74%
jan 1, 2014
1.879
0.0
0.0%
Ranking of countries by current statistics by years


Comments: