29
/
en
AIzaSyAYiBZKx7MnpbEhh9jyipgxe19OcubqV5w
April 1, 2024
64441
Albania
ALB
true
2
1
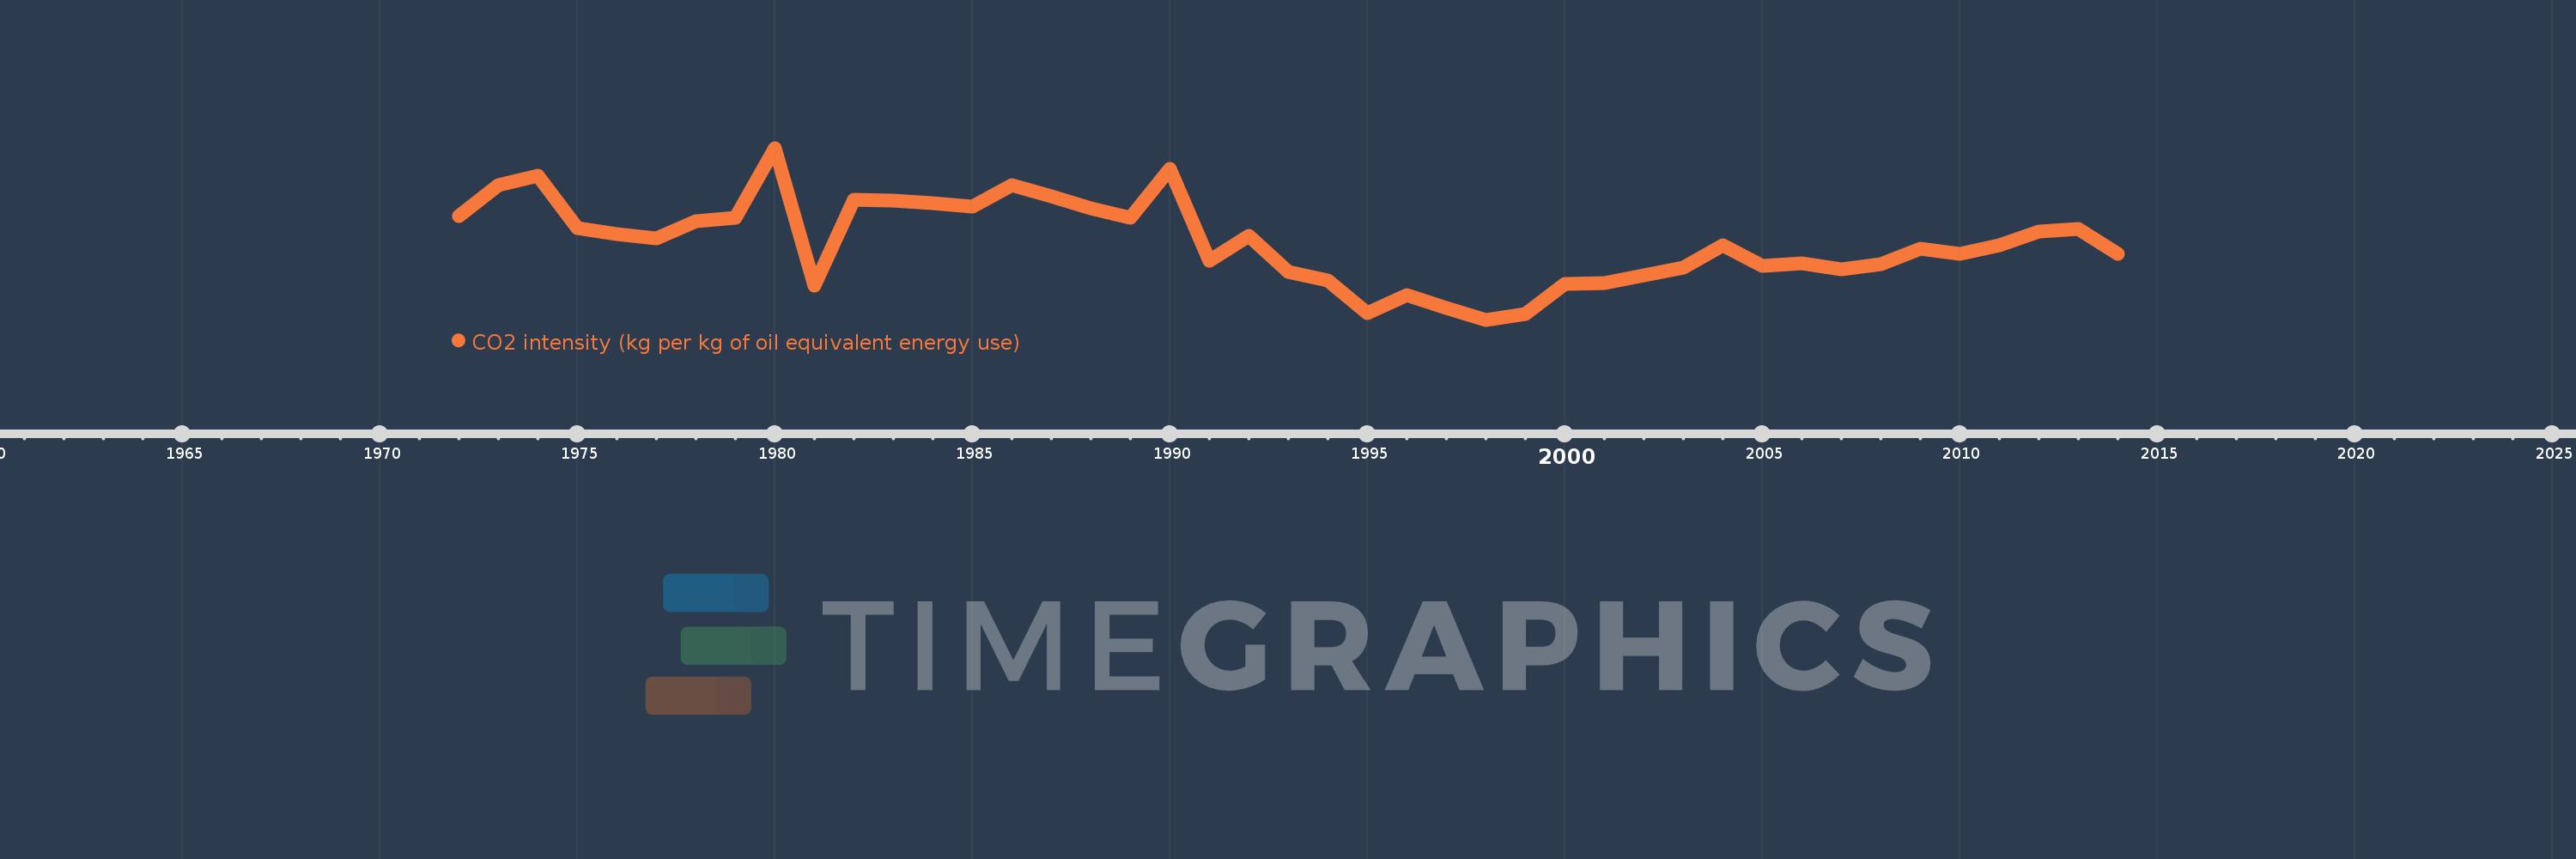
CO2 intensity (kg per kg of oil equivalent energy use)
2014,2013,2012,2011,2010,2009,2008,2007,2006,2005,2004,2003,2002,2001,2000,1999,1998,1997,1996,1995,1994,1993,1992,1991,1990,1989,1988,1987,1986,1985,1984,1983,1982,1981,1980,1979,1978,1977,1976,1975,1974,1973,1972
This statistics in other country:
AlbaniaAlgeriaAngolaAntigua and BarbudaArab WorldArgentinaArmeniaAustraliaAustriaAzerbaijanBahamas, TheBahrainBangladeshBarbadosBelarusBelgiumBelizeBeninBhutanBoliviaBosnia and HerzegovinaBotswanaBrazilBrunei DarussalamBulgariaCabo VerdeCambodiaCameroonCanadaCaribbean small statesCentral Europe and the BalticsChileChinaColombiaComorosCongo, Dem. Rep.Congo, Rep.Costa RicaCote d'IvoireCroatiaCubaCuracaoCyprusCzech RepublicDenmarkDjiboutiDominicaDominican RepublicEarly-demographic dividendEast Asia & PacificEast Asia & Pacific (excluding high income)East Asia & Pacific (IDA & IBRD countries)EcuadorEgypt, Arab Rep.El SalvadorEquatorial GuineaEritreaEstoniaEthiopiaEuro areaEurope & Central AsiaEurope & Central Asia (excluding high income)Europe & Central Asia (IDA & IBRD countries)European UnionFijiFinlandFragile and conflict affected situationsFranceGabonGambia, TheGeorgiaGermanyGhanaGibraltarGreeceGrenadaGuatemalaGuinea-BissauGuyanaHaitiHeavily indebted poor countries (HIPC)High incomeHondurasHong Kong SAR, ChinaHungaryIBRD onlyIcelandIDA & IBRD totalIDA blendIDA onlyIDA totalIndiaIndonesiaIran, Islamic Rep.IraqIrelandIsraelItalyJamaicaJapanJordanKazakhstanKenyaKiribatiKorea, Dem. People’s Rep.Korea, Rep.KuwaitKyrgyz RepublicLate-demographic dividendLatin America & Caribbean Latin America & Caribbean (excluding high income)Latin America & the Caribbean (IDA & IBRD countries)LatviaLeast developed countries: UN classificationLebanonLesothoLibyaLithuaniaLow & middle incomeLow incomeLower middle incomeLuxembourgMacedonia, FYRMalaysiaMaldivesMaltaMarshall IslandsMauritiusMexicoMiddle East & North AfricaMiddle East & North Africa (excluding high income)Middle East & North Africa (IDA & IBRD countries)Middle incomeMoldovaMongoliaMontenegroMoroccoMozambiqueMyanmarNamibiaNepalNetherlandsNew ZealandNicaraguaNigerNigeriaNorth AmericaNorwayOECD membersOmanOther small statesPacific island small statesPakistanPalauPanamaParaguayPeruPhilippinesPolandPortugalPost-demographic dividendPre-demographic dividendQatarRomaniaRussian FederationSamoaSao Tome and PrincipeSaudi ArabiaSenegalSerbiaSeychellesSingaporeSlovak RepublicSloveniaSmall statesSolomon IslandsSouth AfricaSouth AsiaSouth Asia (IDA & IBRD)South SudanSpainSri LankaSt. Kitts and NevisSt. LuciaSt. Vincent and the GrenadinesSub-Saharan Africa Sub-Saharan Africa (excluding high income)Sub-Saharan Africa (IDA & IBRD countries)SudanSurinameSwazilandSwedenSwitzerlandSyrian Arab RepublicTajikistanTanzaniaThailandTimor-LesteTogoTongaTrinidad and TobagoTunisiaTurkeyTurkmenistanUkraineUnited Arab EmiratesUnited KingdomUnited StatesUpper middle incomeUruguayUzbekistanVanuatuVenezuela, RBVietnamWorldYemen, Rep.ZambiaZimbabwe Timeline:
This timeline shows a graph from 1972 to 2014 of Albania. No data until 1971. Number of actual observations by date: 43.
Source name:
World Development Indicators
Source organization:
Carbon Dioxide Information Analysis Center, Environmental Sciences Division, Oak Ridge National Laboratory, Tennessee, United States.
Categories, topics:
Climate Change, Environment
Last updated:
apr 23, 2017
Indicators value changes by year
At the date of observation
Value
Absolute change
Change from previous value
jan 1, 1972
2.534
+2.534
0.0%
jan 1, 1973
2.907
+0.373
14.71%
jan 1, 1974
3.021
+0.114
3.92%
jan 1, 1975
2.38
-0.641
-21.21%
jan 1, 1976
2.31
-0.069
-2.92%
jan 1, 1977
2.26
-0.05
-2.18%
jan 1, 1978
2.464
+0.204
9.02%
jan 1, 1979
2.504
+0.04
1.61%
jan 1, 1980
3.354
+0.85
33.96%
jan 1, 1981
1.683
-1.67
-49.81%
jan 1, 1982
2.722
+1.039
61.73%
jan 1, 1983
2.715
-0.007
-0.26%
jan 1, 1984
2.683
-0.032
-1.19%
jan 1, 1985
2.646
-0.037
-1.38%
jan 1, 1986
2.9
+0.254
9.6%
jan 1, 1987
2.765
-0.135
-4.65%
jan 1, 1988
2.619
-0.147
-5.3%
jan 1, 1989
2.513
-0.105
-4.03%
jan 1, 1990
3.105
+0.592
23.54%
jan 1, 1991
1.987
-1.118
-36.01%
jan 1, 1992
2.291
+0.304
15.32%
jan 1, 1993
1.852
-0.439
-19.15%
jan 1, 1994
1.755
-0.097
-5.24%
jan 1, 1995
1.36
-0.395
-22.5%
jan 1, 1996
1.57
+0.209
15.38%
jan 1, 1997
1.422
-0.148
-9.43%
jan 1, 1998
1.275
-0.147
-10.31%
jan 1, 1999
1.342
+0.067
5.25%
jan 1, 2000
1.709
+0.367
27.36%
jan 1, 2001
1.714
+0.004
0.26%
jan 1, 2002
1.808
+0.094
5.51%
jan 1, 2003
1.906
+0.098
5.42%
jan 1, 2004
2.18
+0.273
14.35%
jan 1, 2005
1.924
-0.256
-11.74%
jan 1, 2006
1.963
+0.039
2.04%
jan 1, 2007
1.89
-0.073
-3.73%
jan 1, 2008
1.945
+0.055
2.93%
jan 1, 2009
2.13
+0.185
9.49%
jan 1, 2010
2.07
-0.06
-2.81%
jan 1, 2011
2.179
+0.109
5.26%
jan 1, 2012
2.342
+0.163
7.49%
jan 1, 2013
2.369
+0.027
1.14%
jan 1, 2014
2.076
-0.292
-12.34%
Ranking of countries by current statistics by years


Comments: