29
/
en
AIzaSyAYiBZKx7MnpbEhh9jyipgxe19OcubqV5w
April 1, 2024
210123
Nicaragua
NIC
true
2
1
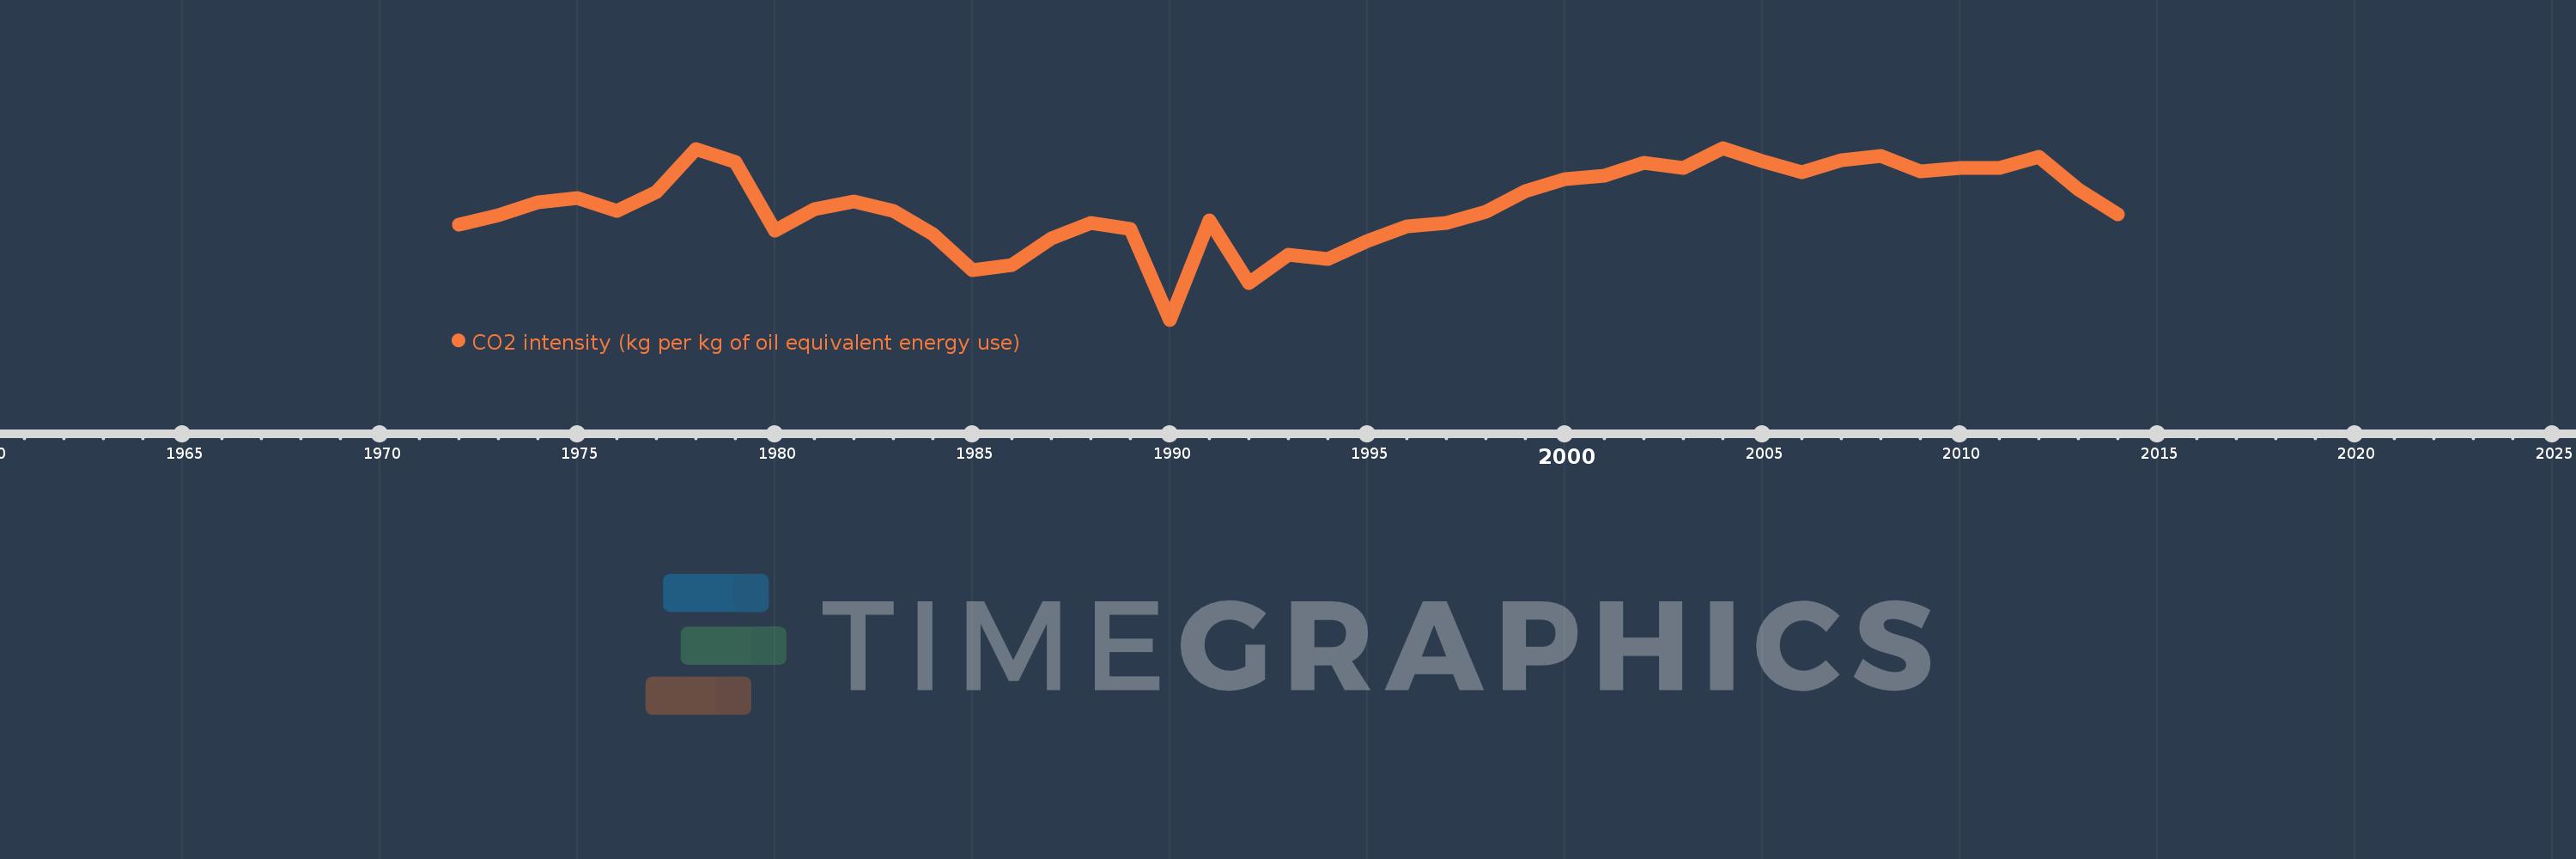
CO2 intensity (kg per kg of oil equivalent energy use)
2014,2013,2012,2011,2010,2009,2008,2007,2006,2005,2004,2003,2002,2001,2000,1999,1998,1997,1996,1995,1994,1993,1992,1991,1990,1989,1988,1987,1986,1985,1984,1983,1982,1981,1980,1979,1978,1977,1976,1975,1974,1973,1972
This statistics in other country:
AlbaniaAlgeriaAngolaAntigua and BarbudaArab WorldArgentinaArmeniaAustraliaAustriaAzerbaijanBahamas, TheBahrainBangladeshBarbadosBelarusBelgiumBelizeBeninBhutanBoliviaBosnia and HerzegovinaBotswanaBrazilBrunei DarussalamBulgariaCabo VerdeCambodiaCameroonCanadaCaribbean small statesCentral Europe and the BalticsChileChinaColombiaComorosCongo, Dem. Rep.Congo, Rep.Costa RicaCote d'IvoireCroatiaCubaCuracaoCyprusCzech RepublicDenmarkDjiboutiDominicaDominican RepublicEarly-demographic dividendEast Asia & PacificEast Asia & Pacific (excluding high income)East Asia & Pacific (IDA & IBRD countries)EcuadorEgypt, Arab Rep.El SalvadorEquatorial GuineaEritreaEstoniaEthiopiaEuro areaEurope & Central AsiaEurope & Central Asia (excluding high income)Europe & Central Asia (IDA & IBRD countries)European UnionFijiFinlandFragile and conflict affected situationsFranceGabonGambia, TheGeorgiaGermanyGhanaGibraltarGreeceGrenadaGuatemalaGuinea-BissauGuyanaHaitiHeavily indebted poor countries (HIPC)High incomeHondurasHong Kong SAR, ChinaHungaryIBRD onlyIcelandIDA & IBRD totalIDA blendIDA onlyIDA totalIndiaIndonesiaIran, Islamic Rep.IraqIrelandIsraelItalyJamaicaJapanJordanKazakhstanKenyaKiribatiKorea, Dem. People’s Rep.Korea, Rep.KuwaitKyrgyz RepublicLate-demographic dividendLatin America & Caribbean Latin America & Caribbean (excluding high income)Latin America & the Caribbean (IDA & IBRD countries)LatviaLeast developed countries: UN classificationLebanonLesothoLibyaLithuaniaLow & middle incomeLow incomeLower middle incomeLuxembourgMacedonia, FYRMalaysiaMaldivesMaltaMarshall IslandsMauritiusMexicoMiddle East & North AfricaMiddle East & North Africa (excluding high income)Middle East & North Africa (IDA & IBRD countries)Middle incomeMoldovaMongoliaMontenegroMoroccoMozambiqueMyanmarNamibiaNepalNetherlandsNew ZealandNicaraguaNigerNigeriaNorth AmericaNorwayOECD membersOmanOther small statesPacific island small statesPakistanPalauPanamaParaguayPeruPhilippinesPolandPortugalPost-demographic dividendPre-demographic dividendQatarRomaniaRussian FederationSamoaSao Tome and PrincipeSaudi ArabiaSenegalSerbiaSeychellesSingaporeSlovak RepublicSloveniaSmall statesSolomon IslandsSouth AfricaSouth AsiaSouth Asia (IDA & IBRD)South SudanSpainSri LankaSt. Kitts and NevisSt. LuciaSt. Vincent and the GrenadinesSub-Saharan Africa Sub-Saharan Africa (excluding high income)Sub-Saharan Africa (IDA & IBRD countries)SudanSurinameSwazilandSwedenSwitzerlandSyrian Arab RepublicTajikistanTanzaniaThailandTimor-LesteTogoTongaTrinidad and TobagoTunisiaTurkeyTurkmenistanUkraineUnited Arab EmiratesUnited KingdomUnited StatesUpper middle incomeUruguayUzbekistanVanuatuVenezuela, RBVietnamWorldYemen, Rep.ZambiaZimbabwe Timeline:
This timeline shows a graph from 1972 to 2014 of Nicaragua. No data until 1971. Number of actual observations by date: 43.
Source name:
World Development Indicators
Source organization:
Carbon Dioxide Information Analysis Center, Environmental Sciences Division, Oak Ridge National Laboratory, Tennessee, United States.
Categories, topics:
Climate Change, Environment
Last updated:
apr 23, 2017
Indicators value changes by year
At the date of observation
Value
Absolute change
Change from previous value
jan 1, 1972
1.238
+1.238
0.0%
jan 1, 1973
1.291
+0.053
4.28%
jan 1, 1974
1.356
+0.065
5.05%
jan 1, 1975
1.377
+0.021
1.57%
jan 1, 1976
1.31
-0.068
-4.91%
jan 1, 1977
1.408
+0.098
7.5%
jan 1, 1978
1.631
+0.223
15.86%
jan 1, 1979
1.566
-0.065
-4.01%
jan 1, 1980
1.208
-0.358
-22.85%
jan 1, 1981
1.321
+0.113
9.35%
jan 1, 1982
1.359
+0.037
2.83%
jan 1, 1983
1.312
-0.046
-3.4%
jan 1, 1984
1.191
-0.121
-9.22%
jan 1, 1985
1.002
-0.189
-15.88%
jan 1, 1986
1.031
+0.029
2.87%
jan 1, 1987
1.171
+0.141
13.63%
jan 1, 1988
1.25
+0.079
6.71%
jan 1, 1989
1.219
-0.031
-2.52%
jan 1, 1990
0.747
-0.471
-38.68%
jan 1, 1991
1.262
+0.515
68.92%
jan 1, 1992
0.936
-0.326
-25.83%
jan 1, 1993
1.084
+0.148
15.83%
jan 1, 1994
1.06
-0.025
-2.27%
jan 1, 1995
1.157
+0.097
9.19%
jan 1, 1996
1.23
+0.073
6.33%
jan 1, 1997
1.25
+0.019
1.56%
jan 1, 1998
1.305
+0.056
4.44%
jan 1, 1999
1.413
+0.108
8.27%
jan 1, 2000
1.477
+0.064
4.5%
jan 1, 2001
1.495
+0.018
1.24%
jan 1, 2002
1.562
+0.067
4.45%
jan 1, 2003
1.534
-0.027
-1.73%
jan 1, 2004
1.638
+0.104
6.76%
jan 1, 2005
1.572
-0.066
-4.05%
jan 1, 2006
1.513
-0.059
-3.76%
jan 1, 2007
1.576
+0.063
4.17%
jan 1, 2008
1.598
+0.022
1.4%
jan 1, 2009
1.517
-0.081
-5.04%
jan 1, 2010
1.533
+0.016
1.03%
jan 1, 2011
1.534
+0.001
0.04%
jan 1, 2012
1.594
+0.061
3.95%
jan 1, 2013
1.421
-0.173
-10.84%
jan 1, 2014
1.294
-0.127
-8.93%
Ranking of countries by current statistics by years


Comments: