29
/
en
AIzaSyAYiBZKx7MnpbEhh9jyipgxe19OcubqV5w
April 1, 2024
264352
Togo
TGO
true
2
1
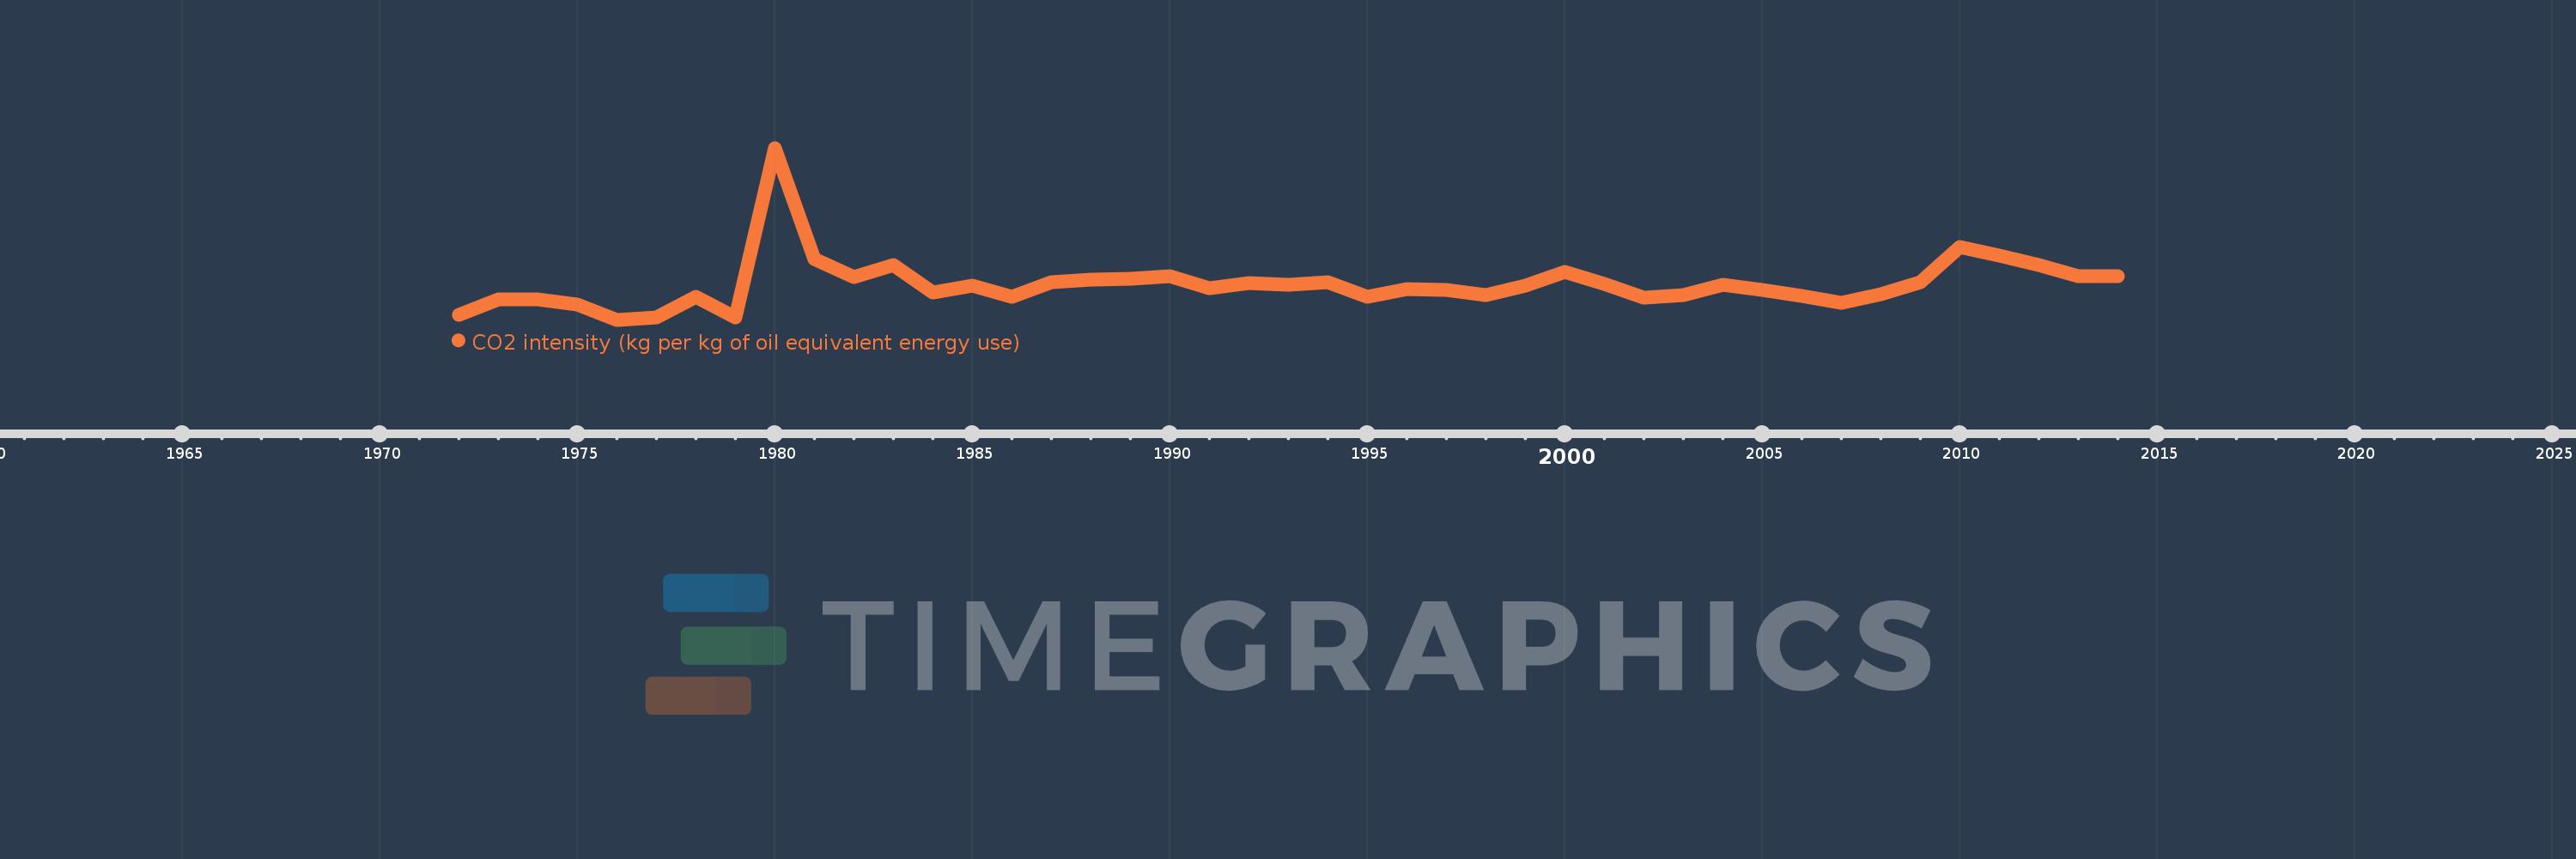
CO2 intensity (kg per kg of oil equivalent energy use)
2014,2013,2012,2011,2010,2009,2008,2007,2006,2005,2004,2003,2002,2001,2000,1999,1998,1997,1996,1995,1994,1993,1992,1991,1990,1989,1988,1987,1986,1985,1984,1983,1982,1981,1980,1979,1978,1977,1976,1975,1974,1973,1972
This statistics in other country:
AlbaniaAlgeriaAngolaAntigua and BarbudaArab WorldArgentinaArmeniaAustraliaAustriaAzerbaijanBahamas, TheBahrainBangladeshBarbadosBelarusBelgiumBelizeBeninBhutanBoliviaBosnia and HerzegovinaBotswanaBrazilBrunei DarussalamBulgariaCabo VerdeCambodiaCameroonCanadaCaribbean small statesCentral Europe and the BalticsChileChinaColombiaComorosCongo, Dem. Rep.Congo, Rep.Costa RicaCote d'IvoireCroatiaCubaCuracaoCyprusCzech RepublicDenmarkDjiboutiDominicaDominican RepublicEarly-demographic dividendEast Asia & PacificEast Asia & Pacific (excluding high income)East Asia & Pacific (IDA & IBRD countries)EcuadorEgypt, Arab Rep.El SalvadorEquatorial GuineaEritreaEstoniaEthiopiaEuro areaEurope & Central AsiaEurope & Central Asia (excluding high income)Europe & Central Asia (IDA & IBRD countries)European UnionFijiFinlandFragile and conflict affected situationsFranceGabonGambia, TheGeorgiaGermanyGhanaGibraltarGreeceGrenadaGuatemalaGuinea-BissauGuyanaHaitiHeavily indebted poor countries (HIPC)High incomeHondurasHong Kong SAR, ChinaHungaryIBRD onlyIcelandIDA & IBRD totalIDA blendIDA onlyIDA totalIndiaIndonesiaIran, Islamic Rep.IraqIrelandIsraelItalyJamaicaJapanJordanKazakhstanKenyaKiribatiKorea, Dem. People’s Rep.Korea, Rep.KuwaitKyrgyz RepublicLate-demographic dividendLatin America & Caribbean Latin America & Caribbean (excluding high income)Latin America & the Caribbean (IDA & IBRD countries)LatviaLeast developed countries: UN classificationLebanonLesothoLibyaLithuaniaLow & middle incomeLow incomeLower middle incomeLuxembourgMacedonia, FYRMalaysiaMaldivesMaltaMarshall IslandsMauritiusMexicoMiddle East & North AfricaMiddle East & North Africa (excluding high income)Middle East & North Africa (IDA & IBRD countries)Middle incomeMoldovaMongoliaMontenegroMoroccoMozambiqueMyanmarNamibiaNepalNetherlandsNew ZealandNicaraguaNigerNigeriaNorth AmericaNorwayOECD membersOmanOther small statesPacific island small statesPakistanPalauPanamaParaguayPeruPhilippinesPolandPortugalPost-demographic dividendPre-demographic dividendQatarRomaniaRussian FederationSamoaSao Tome and PrincipeSaudi ArabiaSenegalSerbiaSeychellesSingaporeSlovak RepublicSloveniaSmall statesSolomon IslandsSouth AfricaSouth AsiaSouth Asia (IDA & IBRD)South SudanSpainSri LankaSt. Kitts and NevisSt. LuciaSt. Vincent and the GrenadinesSub-Saharan Africa Sub-Saharan Africa (excluding high income)Sub-Saharan Africa (IDA & IBRD countries)SudanSurinameSwazilandSwedenSwitzerlandSyrian Arab RepublicTajikistanTanzaniaThailandTimor-LesteTogoTongaTrinidad and TobagoTunisiaTurkeyTurkmenistanUkraineUnited Arab EmiratesUnited KingdomUnited StatesUpper middle incomeUruguayUzbekistanVanuatuVenezuela, RBVietnamWorldYemen, Rep.ZambiaZimbabwe Timeline:
This timeline shows a graph from 1972 to 2014 of Togo. No data until 1971. Number of actual observations by date: 43.
Source name:
World Development Indicators
Source organization:
Carbon Dioxide Information Analysis Center, Environmental Sciences Division, Oak Ridge National Laboratory, Tennessee, United States.
Categories, topics:
Climate Change, Environment
Last updated:
apr 23, 2017
Indicators value changes by year
At the date of observation
Value
Absolute change
Change from previous value
jan 1, 1972
0.434
+0.434
0.0%
jan 1, 1973
0.536
+0.102
23.43%
jan 1, 1974
0.541
+0.005
0.92%
jan 1, 1975
0.506
-0.034
-6.33%
jan 1, 1976
0.401
-0.105
-20.81%
jan 1, 1977
0.415
+0.014
3.4%
jan 1, 1978
0.559
+0.145
34.92%
jan 1, 1979
0.419
-0.141
-25.17%
jan 1, 1980
1.564
+1.145
273.57%
jan 1, 1981
0.81
-0.754
-48.23%
jan 1, 1982
0.692
-0.117
-14.49%
jan 1, 1983
0.769
+0.076
11.04%
jan 1, 1984
0.587
-0.182
-23.64%
jan 1, 1985
0.629
+0.042
7.18%
jan 1, 1986
0.558
-0.071
-11.33%
jan 1, 1987
0.658
+0.1
17.9%
jan 1, 1988
0.673
+0.015
2.31%
jan 1, 1989
0.681
+0.008
1.23%
jan 1, 1990
0.697
+0.016
2.39%
jan 1, 1991
0.613
-0.085
-12.17%
jan 1, 1992
0.652
+0.039
6.43%
jan 1, 1993
0.638
-0.013
-2.07%
jan 1, 1994
0.658
+0.019
3.02%
jan 1, 1995
0.559
-0.098
-14.95%
jan 1, 1996
0.609
+0.049
8.82%
jan 1, 1997
0.603
-0.005
-0.87%
jan 1, 1998
0.57
-0.034
-5.56%
jan 1, 1999
0.63
+0.06
10.59%
jan 1, 2000
0.726
+0.096
15.25%
jan 1, 2001
0.645
-0.082
-11.27%
jan 1, 2002
0.552
-0.093
-14.35%
jan 1, 2003
0.565
+0.013
2.36%
jan 1, 2004
0.635
+0.07
12.45%
jan 1, 2005
0.6
-0.035
-5.51%
jan 1, 2006
0.564
-0.036
-6.01%
jan 1, 2007
0.516
-0.048
-8.58%
jan 1, 2008
0.573
+0.057
11.08%
jan 1, 2009
0.657
+0.084
14.65%
jan 1, 2010
0.893
+0.236
35.96%
jan 1, 2011
0.838
-0.055
-6.18%
jan 1, 2012
0.769
-0.069
-8.25%
jan 1, 2013
0.693
-0.076
-9.9%
jan 1, 2014
0.696
+0.003
0.41%
Ranking of countries by current statistics by years


Comments: