29
/
en
AIzaSyAYiBZKx7MnpbEhh9jyipgxe19OcubqV5w
April 1, 2024
158293
Iraq
IRQ
true
2
1
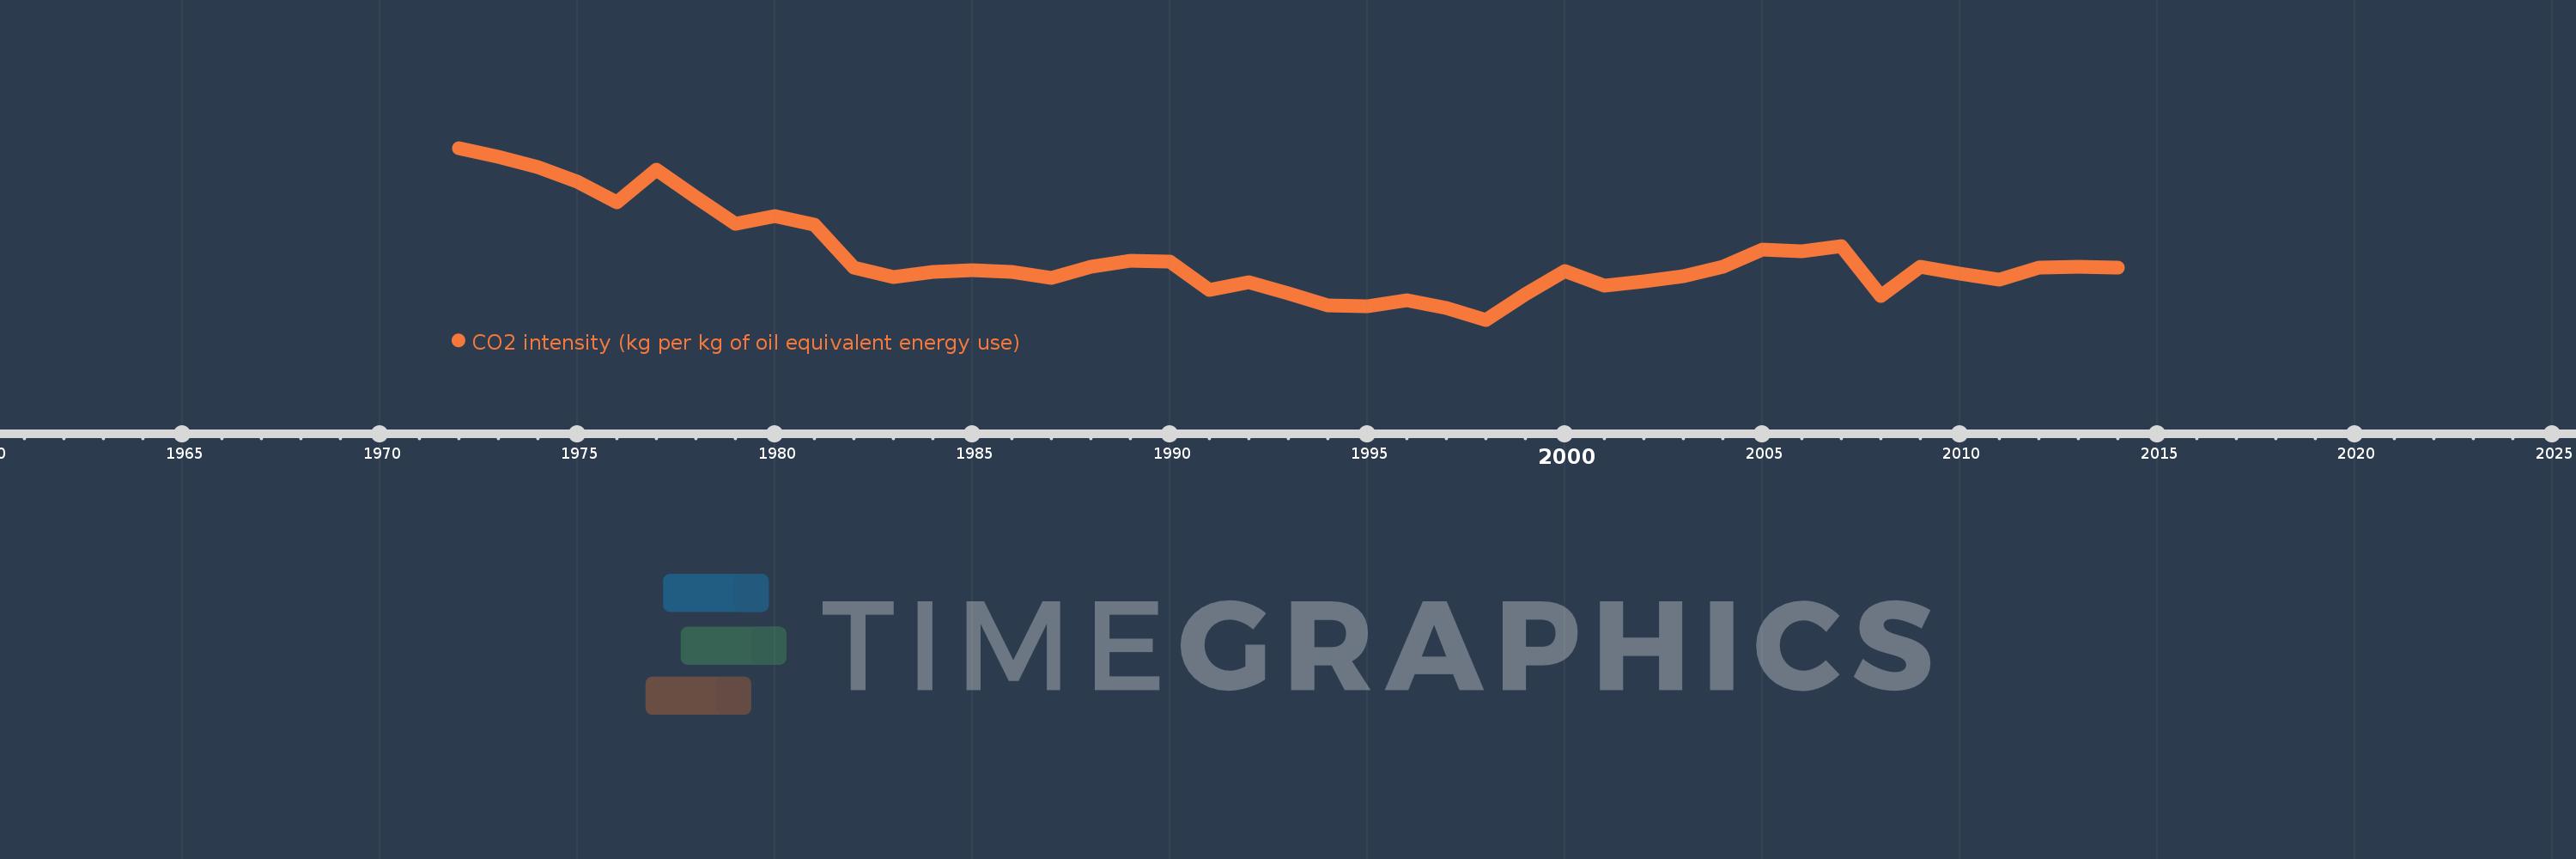
CO2 intensity (kg per kg of oil equivalent energy use)
2014,2013,2012,2011,2010,2009,2008,2007,2006,2005,2004,2003,2002,2001,2000,1999,1998,1997,1996,1995,1994,1993,1992,1991,1990,1989,1988,1987,1986,1985,1984,1983,1982,1981,1980,1979,1978,1977,1976,1975,1974,1973,1972
This statistics in other country:
AlbaniaAlgeriaAngolaAntigua and BarbudaArab WorldArgentinaArmeniaAustraliaAustriaAzerbaijanBahamas, TheBahrainBangladeshBarbadosBelarusBelgiumBelizeBeninBhutanBoliviaBosnia and HerzegovinaBotswanaBrazilBrunei DarussalamBulgariaCabo VerdeCambodiaCameroonCanadaCaribbean small statesCentral Europe and the BalticsChileChinaColombiaComorosCongo, Dem. Rep.Congo, Rep.Costa RicaCote d'IvoireCroatiaCubaCuracaoCyprusCzech RepublicDenmarkDjiboutiDominicaDominican RepublicEarly-demographic dividendEast Asia & PacificEast Asia & Pacific (excluding high income)East Asia & Pacific (IDA & IBRD countries)EcuadorEgypt, Arab Rep.El SalvadorEquatorial GuineaEritreaEstoniaEthiopiaEuro areaEurope & Central AsiaEurope & Central Asia (excluding high income)Europe & Central Asia (IDA & IBRD countries)European UnionFijiFinlandFragile and conflict affected situationsFranceGabonGambia, TheGeorgiaGermanyGhanaGibraltarGreeceGrenadaGuatemalaGuinea-BissauGuyanaHaitiHeavily indebted poor countries (HIPC)High incomeHondurasHong Kong SAR, ChinaHungaryIBRD onlyIcelandIDA & IBRD totalIDA blendIDA onlyIDA totalIndiaIndonesiaIran, Islamic Rep.IraqIrelandIsraelItalyJamaicaJapanJordanKazakhstanKenyaKiribatiKorea, Dem. People’s Rep.Korea, Rep.KuwaitKyrgyz RepublicLate-demographic dividendLatin America & Caribbean Latin America & Caribbean (excluding high income)Latin America & the Caribbean (IDA & IBRD countries)LatviaLeast developed countries: UN classificationLebanonLesothoLibyaLithuaniaLow & middle incomeLow incomeLower middle incomeLuxembourgMacedonia, FYRMalaysiaMaldivesMaltaMarshall IslandsMauritiusMexicoMiddle East & North AfricaMiddle East & North Africa (excluding high income)Middle East & North Africa (IDA & IBRD countries)Middle incomeMoldovaMongoliaMontenegroMoroccoMozambiqueMyanmarNamibiaNepalNetherlandsNew ZealandNicaraguaNigerNigeriaNorth AmericaNorwayOECD membersOmanOther small statesPacific island small statesPakistanPalauPanamaParaguayPeruPhilippinesPolandPortugalPost-demographic dividendPre-demographic dividendQatarRomaniaRussian FederationSamoaSao Tome and PrincipeSaudi ArabiaSenegalSerbiaSeychellesSingaporeSlovak RepublicSloveniaSmall statesSolomon IslandsSouth AfricaSouth AsiaSouth Asia (IDA & IBRD)South SudanSpainSri LankaSt. Kitts and NevisSt. LuciaSt. Vincent and the GrenadinesSub-Saharan Africa Sub-Saharan Africa (excluding high income)Sub-Saharan Africa (IDA & IBRD countries)SudanSurinameSwazilandSwedenSwitzerlandSyrian Arab RepublicTajikistanTanzaniaThailandTimor-LesteTogoTongaTrinidad and TobagoTunisiaTurkeyTurkmenistanUkraineUnited Arab EmiratesUnited KingdomUnited StatesUpper middle incomeUruguayUzbekistanVanuatuVenezuela, RBVietnamWorldYemen, Rep.ZambiaZimbabwe Timeline:
This timeline shows a graph from 1972 to 2014 of Iraq. No data until 1971. Number of actual observations by date: 43.
Source name:
World Development Indicators
Source organization:
Carbon Dioxide Information Analysis Center, Environmental Sciences Division, Oak Ridge National Laboratory, Tennessee, United States.
Categories, topics:
Climate Change, Environment
Last updated:
apr 23, 2017
Indicators value changes by year
At the date of observation
Value
Absolute change
Change from previous value
jan 1, 1972
7.176
+7.176
0.0%
jan 1, 1973
6.881
-0.295
-4.11%
jan 1, 1974
6.577
-0.305
-4.43%
jan 1, 1975
6.108
-0.468
-7.12%
jan 1, 1976
5.439
-0.67
-10.96%
jan 1, 1977
6.471
+1.032
18.97%
jan 1, 1978
5.6
-0.87
-13.45%
jan 1, 1979
4.759
-0.841
-15.02%
jan 1, 1980
4.999
+0.24
5.04%
jan 1, 1981
4.726
-0.273
-5.47%
jan 1, 1982
3.353
-1.373
-29.06%
jan 1, 1983
3.073
-0.28
-8.36%
jan 1, 1984
3.224
+0.151
4.93%
jan 1, 1985
3.28
+0.056
1.74%
jan 1, 1986
3.233
-0.047
-1.44%
jan 1, 1987
3.047
-0.186
-5.74%
jan 1, 1988
3.387
+0.34
11.15%
jan 1, 1989
3.589
+0.202
5.95%
jan 1, 1990
3.545
-0.044
-1.22%
jan 1, 1991
2.666
-0.879
-24.8%
jan 1, 1992
2.889
+0.223
8.38%
jan 1, 1993
2.547
-0.342
-11.85%
jan 1, 1994
2.165
-0.382
-15.0%
jan 1, 1995
2.146
-0.018
-0.85%
jan 1, 1996
2.326
+0.179
8.36%
jan 1, 1997
2.08
-0.246
-10.57%
jan 1, 1998
1.705
-0.375
-18.03%
jan 1, 1999
2.522
+0.817
47.93%
jan 1, 2000
3.256
+0.734
29.1%
jan 1, 2001
2.779
-0.477
-14.66%
jan 1, 2002
2.931
+0.152
5.47%
jan 1, 2003
3.093
+0.163
5.55%
jan 1, 2004
3.395
+0.302
9.77%
jan 1, 2005
3.927
+0.532
15.66%
jan 1, 2006
3.891
-0.036
-0.92%
jan 1, 2007
4.056
+0.164
4.23%
jan 1, 2008
2.45
-1.605
-39.58%
jan 1, 2009
3.39
+0.939
38.33%
jan 1, 2010
3.174
-0.215
-6.36%
jan 1, 2011
2.987
-0.187
-5.9%
jan 1, 2012
3.358
+0.371
12.44%
jan 1, 2013
3.403
+0.045
1.34%
jan 1, 2014
3.355
-0.048
-1.42%
Ranking of countries by current statistics by years


Comments: