29
/
en
AIzaSyAYiBZKx7MnpbEhh9jyipgxe19OcubqV5w
April 1, 2024
235496
Senegal
SEN
true
2
1
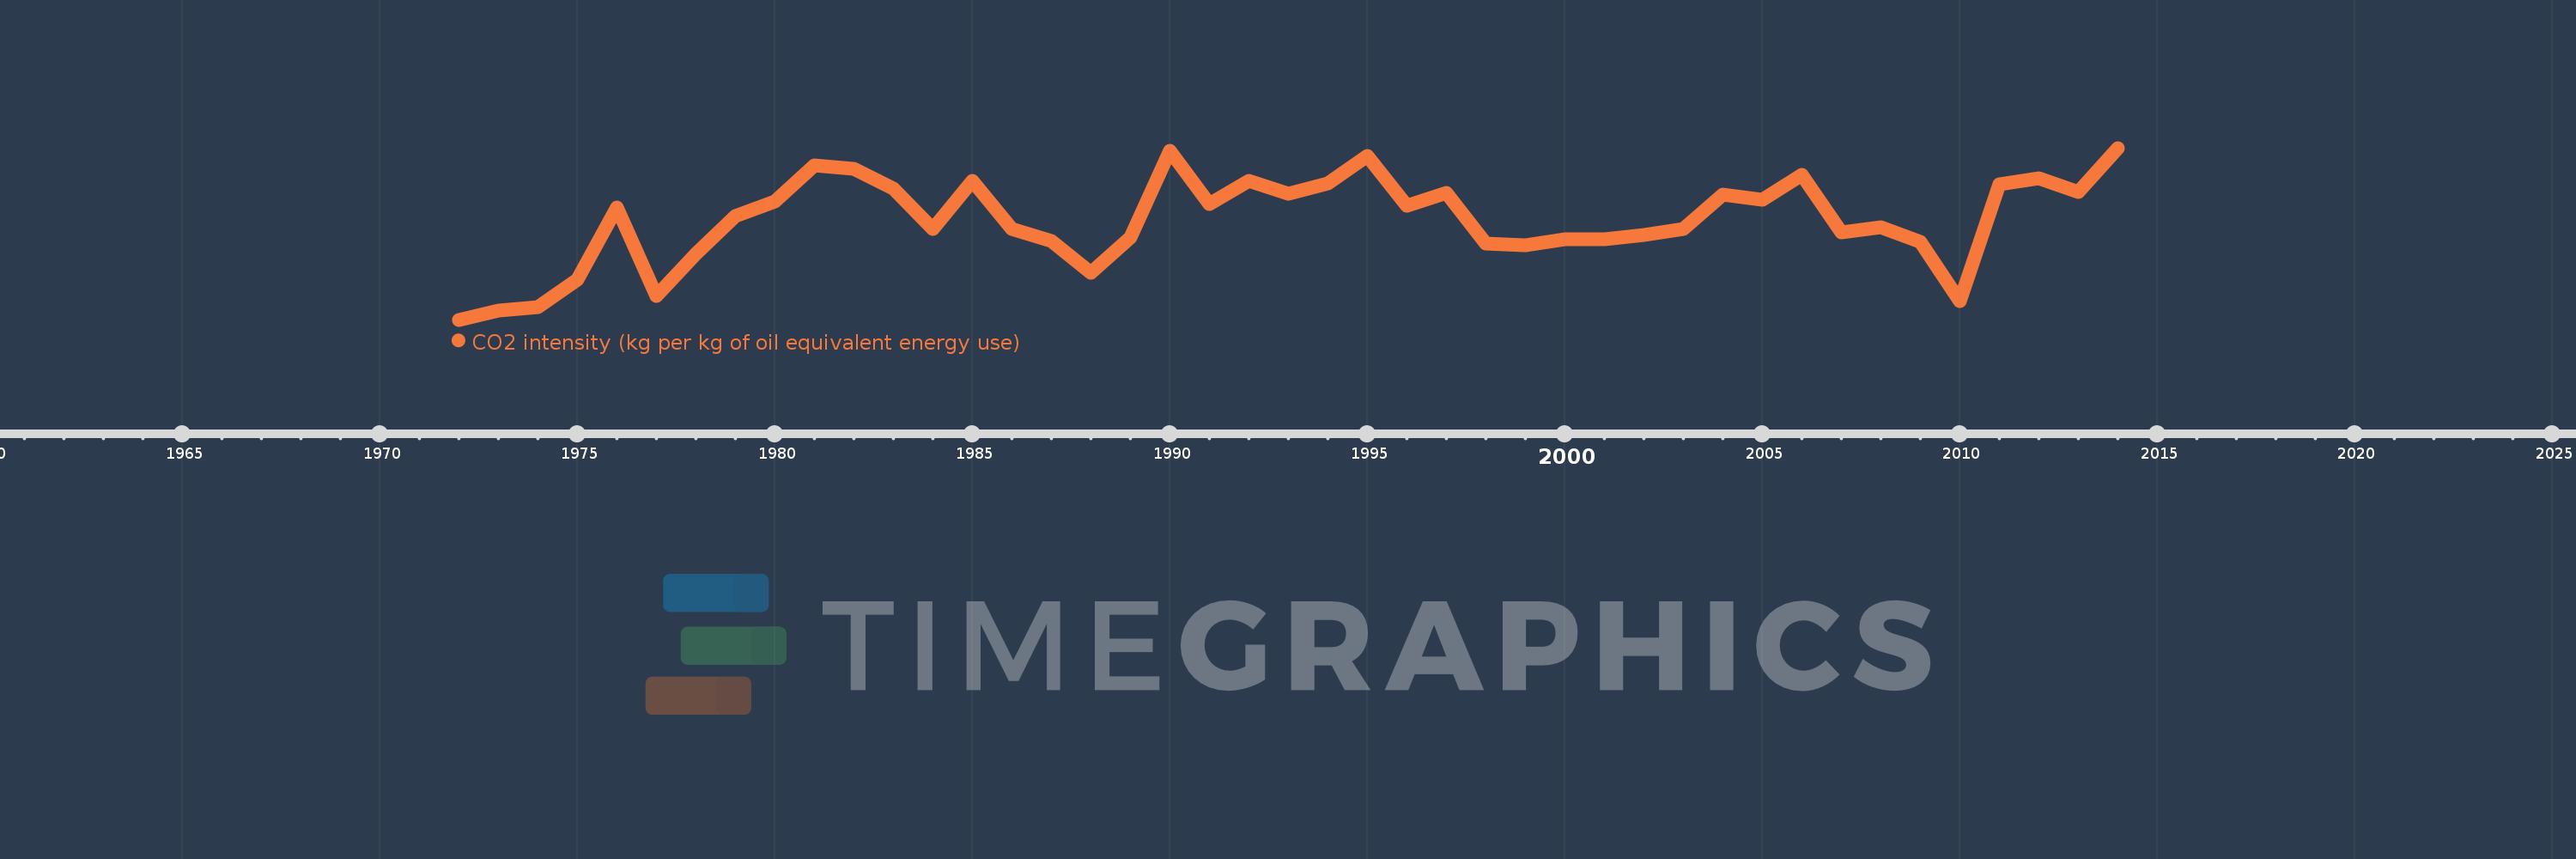
CO2 intensity (kg per kg of oil equivalent energy use)
2014,2013,2012,2011,2010,2009,2008,2007,2006,2005,2004,2003,2002,2001,2000,1999,1998,1997,1996,1995,1994,1993,1992,1991,1990,1989,1988,1987,1986,1985,1984,1983,1982,1981,1980,1979,1978,1977,1976,1975,1974,1973,1972
This statistics in other country:
AlbaniaAlgeriaAngolaAntigua and BarbudaArab WorldArgentinaArmeniaAustraliaAustriaAzerbaijanBahamas, TheBahrainBangladeshBarbadosBelarusBelgiumBelizeBeninBhutanBoliviaBosnia and HerzegovinaBotswanaBrazilBrunei DarussalamBulgariaCabo VerdeCambodiaCameroonCanadaCaribbean small statesCentral Europe and the BalticsChileChinaColombiaComorosCongo, Dem. Rep.Congo, Rep.Costa RicaCote d'IvoireCroatiaCubaCuracaoCyprusCzech RepublicDenmarkDjiboutiDominicaDominican RepublicEarly-demographic dividendEast Asia & PacificEast Asia & Pacific (excluding high income)East Asia & Pacific (IDA & IBRD countries)EcuadorEgypt, Arab Rep.El SalvadorEquatorial GuineaEritreaEstoniaEthiopiaEuro areaEurope & Central AsiaEurope & Central Asia (excluding high income)Europe & Central Asia (IDA & IBRD countries)European UnionFijiFinlandFragile and conflict affected situationsFranceGabonGambia, TheGeorgiaGermanyGhanaGibraltarGreeceGrenadaGuatemalaGuinea-BissauGuyanaHaitiHeavily indebted poor countries (HIPC)High incomeHondurasHong Kong SAR, ChinaHungaryIBRD onlyIcelandIDA & IBRD totalIDA blendIDA onlyIDA totalIndiaIndonesiaIran, Islamic Rep.IraqIrelandIsraelItalyJamaicaJapanJordanKazakhstanKenyaKiribatiKorea, Dem. People’s Rep.Korea, Rep.KuwaitKyrgyz RepublicLate-demographic dividendLatin America & Caribbean Latin America & Caribbean (excluding high income)Latin America & the Caribbean (IDA & IBRD countries)LatviaLeast developed countries: UN classificationLebanonLesothoLibyaLithuaniaLow & middle incomeLow incomeLower middle incomeLuxembourgMacedonia, FYRMalaysiaMaldivesMaltaMarshall IslandsMauritiusMexicoMiddle East & North AfricaMiddle East & North Africa (excluding high income)Middle East & North Africa (IDA & IBRD countries)Middle incomeMoldovaMongoliaMontenegroMoroccoMozambiqueMyanmarNamibiaNepalNetherlandsNew ZealandNicaraguaNigerNigeriaNorth AmericaNorwayOECD membersOmanOther small statesPacific island small statesPakistanPalauPanamaParaguayPeruPhilippinesPolandPortugalPost-demographic dividendPre-demographic dividendQatarRomaniaRussian FederationSamoaSao Tome and PrincipeSaudi ArabiaSenegalSerbiaSeychellesSingaporeSlovak RepublicSloveniaSmall statesSolomon IslandsSouth AfricaSouth AsiaSouth Asia (IDA & IBRD)South SudanSpainSri LankaSt. Kitts and NevisSt. LuciaSt. Vincent and the GrenadinesSub-Saharan Africa Sub-Saharan Africa (excluding high income)Sub-Saharan Africa (IDA & IBRD countries)SudanSurinameSwazilandSwedenSwitzerlandSyrian Arab RepublicTajikistanTanzaniaThailandTimor-LesteTogoTongaTrinidad and TobagoTunisiaTurkeyTurkmenistanUkraineUnited Arab EmiratesUnited KingdomUnited StatesUpper middle incomeUruguayUzbekistanVanuatuVenezuela, RBVietnamWorldYemen, Rep.ZambiaZimbabwe Timeline:
This timeline shows a graph from 1972 to 2014 of Senegal. No data until 1971. Number of actual observations by date: 43.
Source name:
World Development Indicators
Source organization:
Carbon Dioxide Information Analysis Center, Environmental Sciences Division, Oak Ridge National Laboratory, Tennessee, United States.
Categories, topics:
Climate Change, Environment
Last updated:
apr 23, 2017
Indicators value changes by year
At the date of observation
Value
Absolute change
Change from previous value
jan 1, 1972
1.09
+1.09
0.0%
jan 1, 1973
1.156
+0.066
6.06%
jan 1, 1974
1.176
+0.02
1.76%
jan 1, 1975
1.366
+0.19
16.18%
jan 1, 1976
1.86
+0.494
36.12%
jan 1, 1977
1.251
-0.609
-32.72%
jan 1, 1978
1.543
+0.292
23.31%
jan 1, 1979
1.804
+0.26
16.88%
jan 1, 1980
1.903
+0.1
5.52%
jan 1, 1981
2.147
+0.244
12.83%
jan 1, 1982
2.127
-0.02
-0.94%
jan 1, 1983
1.99
-0.137
-6.46%
jan 1, 1984
1.711
-0.279
-14.0%
jan 1, 1985
2.043
+0.331
19.37%
jan 1, 1986
1.715
-0.327
-16.03%
jan 1, 1987
1.63
-0.085
-4.96%
jan 1, 1988
1.41
-0.221
-13.54%
jan 1, 1989
1.657
+0.248
17.58%
jan 1, 1990
2.247
+0.59
35.59%
jan 1, 1991
1.887
-0.36
-16.01%
jan 1, 1992
2.046
+0.159
8.43%
jan 1, 1993
1.956
-0.09
-4.41%
jan 1, 1994
2.027
+0.071
3.62%
jan 1, 1995
2.216
+0.189
9.31%
jan 1, 1996
1.874
-0.342
-15.42%
jan 1, 1997
1.958
+0.084
4.51%
jan 1, 1998
1.612
-0.347
-17.71%
jan 1, 1999
1.603
-0.008
-0.51%
jan 1, 2000
1.641
+0.038
2.36%
jan 1, 2001
1.642
+0.001
0.07%
jan 1, 2002
1.671
+0.029
1.74%
jan 1, 2003
1.714
+0.043
2.56%
jan 1, 2004
1.946
+0.232
13.55%
jan 1, 2005
1.912
-0.034
-1.73%
jan 1, 2006
2.082
+0.17
8.87%
jan 1, 2007
1.69
-0.392
-18.82%
jan 1, 2008
1.725
+0.035
2.09%
jan 1, 2009
1.625
-0.101
-5.83%
jan 1, 2010
1.219
-0.406
-24.96%
jan 1, 2011
2.021
+0.802
65.79%
jan 1, 2012
2.063
+0.041
2.04%
jan 1, 2013
1.966
-0.097
-4.68%
jan 1, 2014
2.269
+0.303
15.42%
Ranking of countries by current statistics by years


Comments: