29
/
en
AIzaSyAYiBZKx7MnpbEhh9jyipgxe19OcubqV5w
April 1, 2024
252808
Sudan
SDN
true
2
1
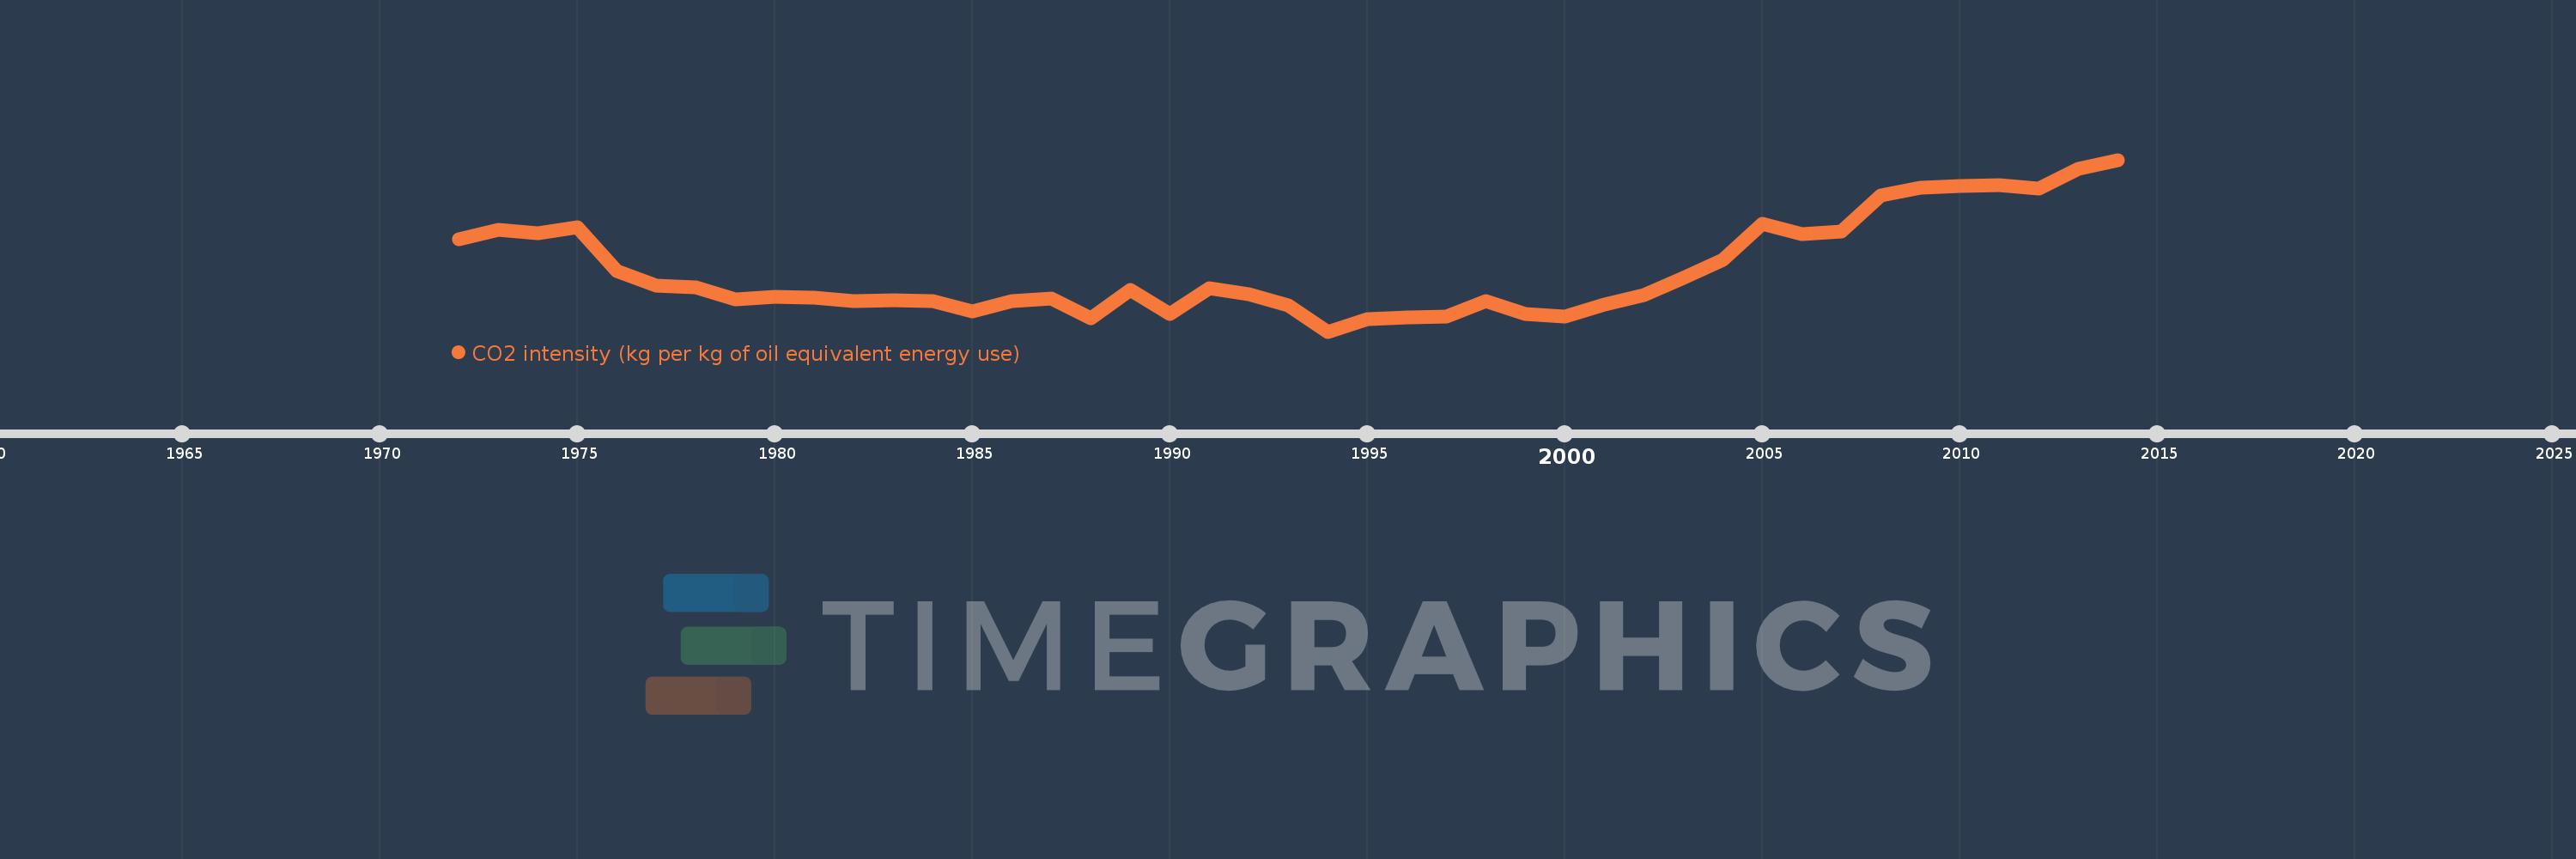
CO2 intensity (kg per kg of oil equivalent energy use)
2014,2013,2012,2011,2010,2009,2008,2007,2006,2005,2004,2003,2002,2001,2000,1999,1998,1997,1996,1995,1994,1993,1992,1991,1990,1989,1988,1987,1986,1985,1984,1983,1982,1981,1980,1979,1978,1977,1976,1975,1974,1973,1972
This statistics in other country:
AlbaniaAlgeriaAngolaAntigua and BarbudaArab WorldArgentinaArmeniaAustraliaAustriaAzerbaijanBahamas, TheBahrainBangladeshBarbadosBelarusBelgiumBelizeBeninBhutanBoliviaBosnia and HerzegovinaBotswanaBrazilBrunei DarussalamBulgariaCabo VerdeCambodiaCameroonCanadaCaribbean small statesCentral Europe and the BalticsChileChinaColombiaComorosCongo, Dem. Rep.Congo, Rep.Costa RicaCote d'IvoireCroatiaCubaCuracaoCyprusCzech RepublicDenmarkDjiboutiDominicaDominican RepublicEarly-demographic dividendEast Asia & PacificEast Asia & Pacific (excluding high income)East Asia & Pacific (IDA & IBRD countries)EcuadorEgypt, Arab Rep.El SalvadorEquatorial GuineaEritreaEstoniaEthiopiaEuro areaEurope & Central AsiaEurope & Central Asia (excluding high income)Europe & Central Asia (IDA & IBRD countries)European UnionFijiFinlandFragile and conflict affected situationsFranceGabonGambia, TheGeorgiaGermanyGhanaGibraltarGreeceGrenadaGuatemalaGuinea-BissauGuyanaHaitiHeavily indebted poor countries (HIPC)High incomeHondurasHong Kong SAR, ChinaHungaryIBRD onlyIcelandIDA & IBRD totalIDA blendIDA onlyIDA totalIndiaIndonesiaIran, Islamic Rep.IraqIrelandIsraelItalyJamaicaJapanJordanKazakhstanKenyaKiribatiKorea, Dem. People’s Rep.Korea, Rep.KuwaitKyrgyz RepublicLate-demographic dividendLatin America & Caribbean Latin America & Caribbean (excluding high income)Latin America & the Caribbean (IDA & IBRD countries)LatviaLeast developed countries: UN classificationLebanonLesothoLibyaLithuaniaLow & middle incomeLow incomeLower middle incomeLuxembourgMacedonia, FYRMalaysiaMaldivesMaltaMarshall IslandsMauritiusMexicoMiddle East & North AfricaMiddle East & North Africa (excluding high income)Middle East & North Africa (IDA & IBRD countries)Middle incomeMoldovaMongoliaMontenegroMoroccoMozambiqueMyanmarNamibiaNepalNetherlandsNew ZealandNicaraguaNigerNigeriaNorth AmericaNorwayOECD membersOmanOther small statesPacific island small statesPakistanPalauPanamaParaguayPeruPhilippinesPolandPortugalPost-demographic dividendPre-demographic dividendQatarRomaniaRussian FederationSamoaSao Tome and PrincipeSaudi ArabiaSenegalSerbiaSeychellesSingaporeSlovak RepublicSloveniaSmall statesSolomon IslandsSouth AfricaSouth AsiaSouth Asia (IDA & IBRD)South SudanSpainSri LankaSt. Kitts and NevisSt. LuciaSt. Vincent and the GrenadinesSub-Saharan Africa Sub-Saharan Africa (excluding high income)Sub-Saharan Africa (IDA & IBRD countries)SudanSurinameSwazilandSwedenSwitzerlandSyrian Arab RepublicTajikistanTanzaniaThailandTimor-LesteTogoTongaTrinidad and TobagoTunisiaTurkeyTurkmenistanUkraineUnited Arab EmiratesUnited KingdomUnited StatesUpper middle incomeUruguayUzbekistanVanuatuVenezuela, RBVietnamWorldYemen, Rep.ZambiaZimbabwe Timeline:
This timeline shows a graph from 1972 to 2014 of Sudan. No data until 1971. Number of actual observations by date: 43.
Source name:
World Development Indicators
Source organization:
Carbon Dioxide Information Analysis Center, Environmental Sciences Division, Oak Ridge National Laboratory, Tennessee, United States.
Categories, topics:
Climate Change, Environment
Last updated:
apr 23, 2017
Indicators value changes by year
At the date of observation
Value
Absolute change
Change from previous value
jan 1, 1972
0.709
+0.709
0.0%
jan 1, 1973
0.752
+0.043
6.1%
jan 1, 1974
0.737
-0.016
-2.07%
jan 1, 1975
0.764
+0.027
3.64%
jan 1, 1976
0.568
-0.196
-25.66%
jan 1, 1977
0.502
-0.065
-11.52%
jan 1, 1978
0.494
-0.008
-1.61%
jan 1, 1979
0.44
-0.054
-11.01%
jan 1, 1980
0.452
+0.012
2.84%
jan 1, 1981
0.448
-0.004
-0.94%
jan 1, 1982
0.431
-0.017
-3.77%
jan 1, 1983
0.434
+0.003
0.61%
jan 1, 1984
0.429
-0.005
-1.08%
jan 1, 1985
0.386
-0.043
-10.05%
jan 1, 1986
0.43
+0.044
11.48%
jan 1, 1987
0.442
+0.012
2.84%
jan 1, 1988
0.354
-0.088
-19.89%
jan 1, 1989
0.483
+0.128
36.13%
jan 1, 1990
0.374
-0.108
-22.43%
jan 1, 1991
0.491
+0.117
31.24%
jan 1, 1992
0.461
-0.03
-6.14%
jan 1, 1993
0.413
-0.048
-10.43%
jan 1, 1994
0.293
-0.12
-28.94%
jan 1, 1995
0.348
+0.054
18.42%
jan 1, 1996
0.359
+0.011
3.24%
jan 1, 1997
0.361
+0.003
0.7%
jan 1, 1998
0.432
+0.071
19.67%
jan 1, 1999
0.371
-0.062
-14.29%
jan 1, 2000
0.362
-0.009
-2.34%
jan 1, 2001
0.416
+0.054
14.93%
jan 1, 2002
0.457
+0.041
9.89%
jan 1, 2003
0.537
+0.08
17.41%
jan 1, 2004
0.617
+0.08
14.95%
jan 1, 2005
0.78
+0.163
26.4%
jan 1, 2006
0.733
-0.046
-5.95%
jan 1, 2007
0.747
+0.013
1.83%
jan 1, 2008
0.908
+0.161
21.59%
jan 1, 2009
0.944
+0.036
3.96%
jan 1, 2010
0.952
+0.008
0.88%
jan 1, 2011
0.955
+0.003
0.27%
jan 1, 2012
0.941
-0.014
-1.43%
jan 1, 2013
1.031
+0.09
9.6%
jan 1, 2014
1.07
+0.039
3.75%
Ranking of countries by current statistics by years


Comments: