29
/
en
AIzaSyAYiBZKx7MnpbEhh9jyipgxe19OcubqV5w
April 1, 2024
52474
OECD members
OED
false
2
1
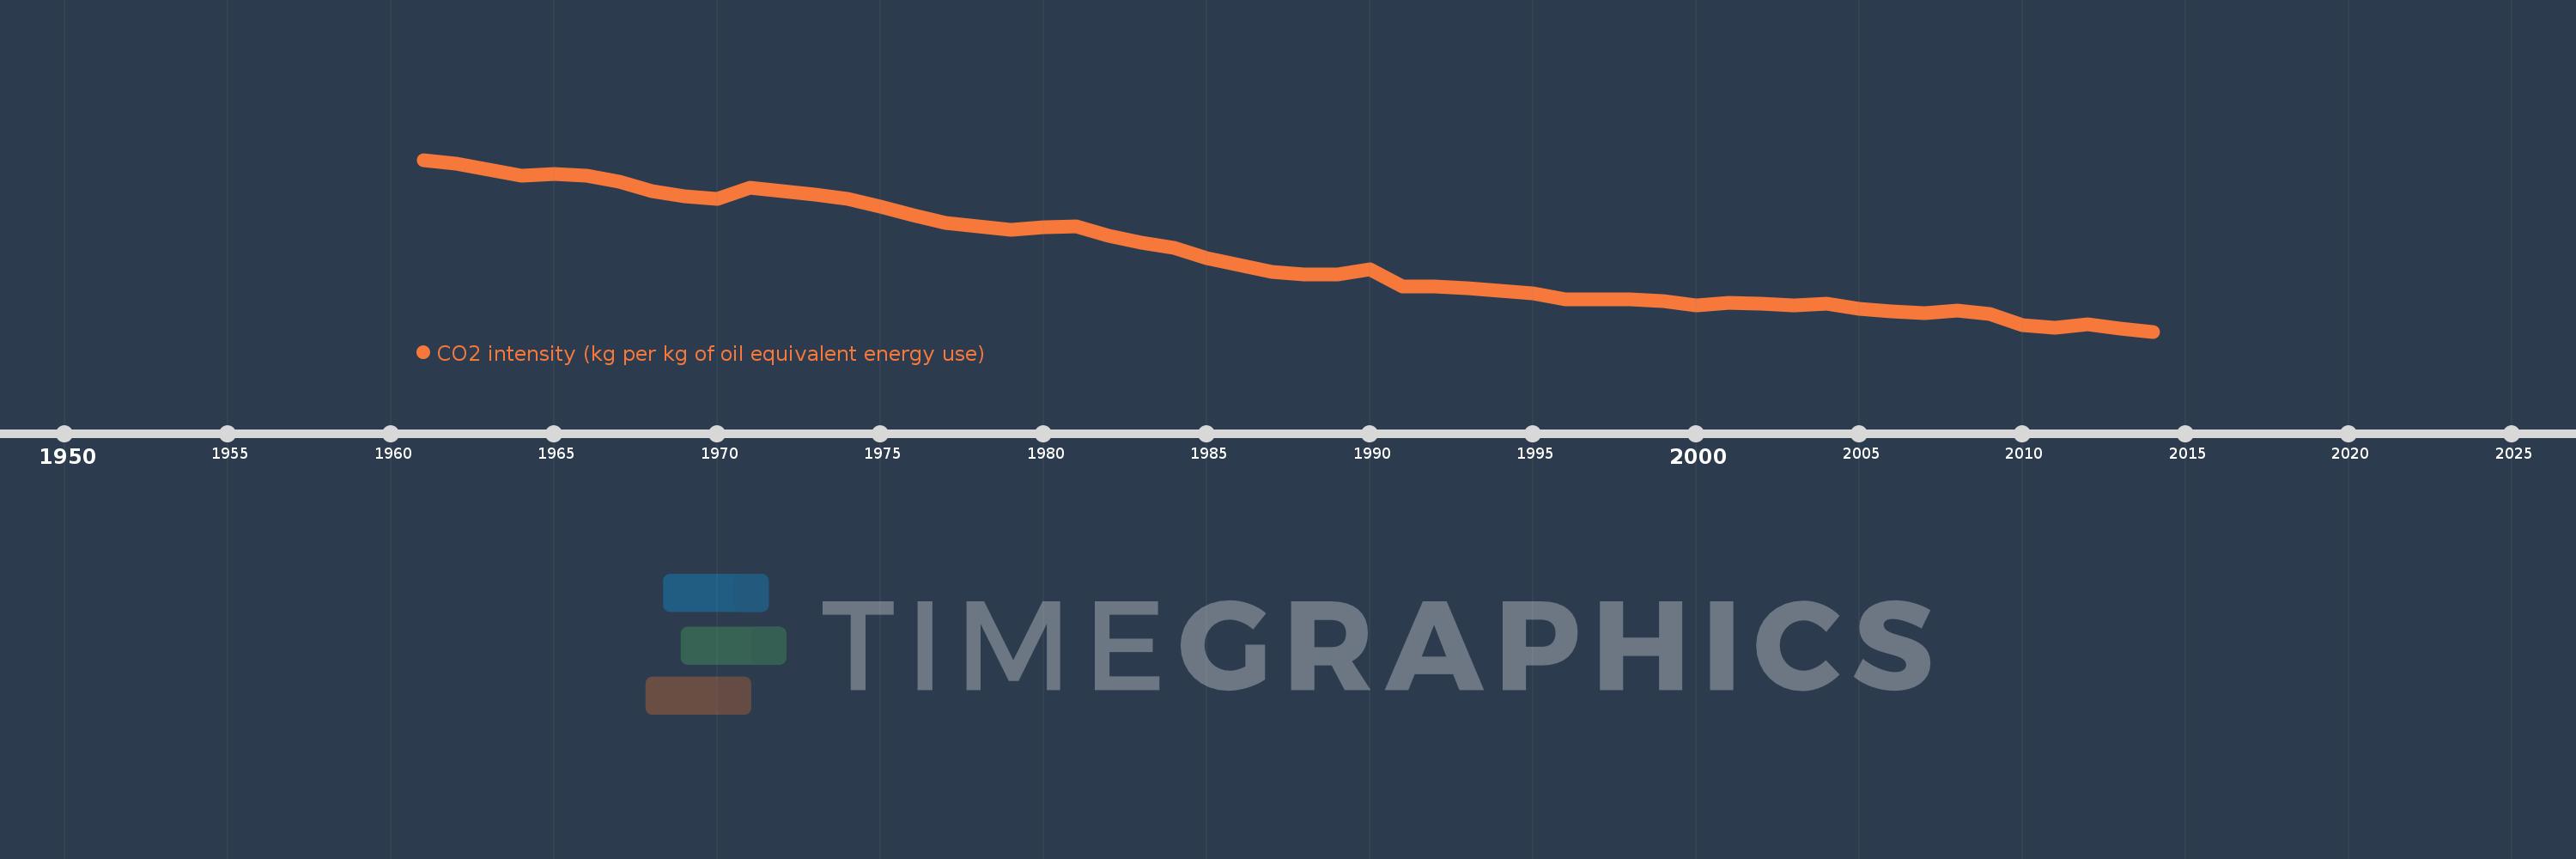
CO2 intensity (kg per kg of oil equivalent energy use)
2014,2013,2012,2011,2010,2009,2008,2007,2006,2005,2004,2003,2002,2001,2000,1999,1998,1997,1996,1995,1994,1993,1992,1991,1990,1989,1988,1987,1986,1985,1984,1983,1982,1981,1980,1979,1978,1977,1976,1975,1974,1973,1972,1971,1970,1969,1968,1967,1966,1965,1964,1963,1962,1961
This statistics in other country:
AlbaniaAlgeriaAngolaAntigua and BarbudaArab WorldArgentinaArmeniaAustraliaAustriaAzerbaijanBahamas, TheBahrainBangladeshBarbadosBelarusBelgiumBelizeBeninBhutanBoliviaBosnia and HerzegovinaBotswanaBrazilBrunei DarussalamBulgariaCabo VerdeCambodiaCameroonCanadaCaribbean small statesCentral Europe and the BalticsChileChinaColombiaComorosCongo, Dem. Rep.Congo, Rep.Costa RicaCote d'IvoireCroatiaCubaCuracaoCyprusCzech RepublicDenmarkDjiboutiDominicaDominican RepublicEarly-demographic dividendEast Asia & PacificEast Asia & Pacific (excluding high income)East Asia & Pacific (IDA & IBRD countries)EcuadorEgypt, Arab Rep.El SalvadorEquatorial GuineaEritreaEstoniaEthiopiaEuro areaEurope & Central AsiaEurope & Central Asia (excluding high income)Europe & Central Asia (IDA & IBRD countries)European UnionFijiFinlandFragile and conflict affected situationsFranceGabonGambia, TheGeorgiaGermanyGhanaGibraltarGreeceGrenadaGuatemalaGuinea-BissauGuyanaHaitiHeavily indebted poor countries (HIPC)High incomeHondurasHong Kong SAR, ChinaHungaryIBRD onlyIcelandIDA & IBRD totalIDA blendIDA onlyIDA totalIndiaIndonesiaIran, Islamic Rep.IraqIrelandIsraelItalyJamaicaJapanJordanKazakhstanKenyaKiribatiKorea, Dem. People’s Rep.Korea, Rep.KuwaitKyrgyz RepublicLate-demographic dividendLatin America & Caribbean Latin America & Caribbean (excluding high income)Latin America & the Caribbean (IDA & IBRD countries)LatviaLeast developed countries: UN classificationLebanonLesothoLibyaLithuaniaLow & middle incomeLow incomeLower middle incomeLuxembourgMacedonia, FYRMalaysiaMaldivesMaltaMarshall IslandsMauritiusMexicoMiddle East & North AfricaMiddle East & North Africa (excluding high income)Middle East & North Africa (IDA & IBRD countries)Middle incomeMoldovaMongoliaMontenegroMoroccoMozambiqueMyanmarNamibiaNepalNetherlandsNew ZealandNicaraguaNigerNigeriaNorth AmericaNorwayOECD membersOmanOther small statesPacific island small statesPakistanPalauPanamaParaguayPeruPhilippinesPolandPortugalPost-demographic dividendPre-demographic dividendQatarRomaniaRussian FederationSamoaSao Tome and PrincipeSaudi ArabiaSenegalSerbiaSeychellesSingaporeSlovak RepublicSloveniaSmall statesSolomon IslandsSouth AfricaSouth AsiaSouth Asia (IDA & IBRD)South SudanSpainSri LankaSt. Kitts and NevisSt. LuciaSt. Vincent and the GrenadinesSub-Saharan Africa Sub-Saharan Africa (excluding high income)Sub-Saharan Africa (IDA & IBRD countries)SudanSurinameSwazilandSwedenSwitzerlandSyrian Arab RepublicTajikistanTanzaniaThailandTimor-LesteTogoTongaTrinidad and TobagoTunisiaTurkeyTurkmenistanUkraineUnited Arab EmiratesUnited KingdomUnited StatesUpper middle incomeUruguayUzbekistanVanuatuVenezuela, RBVietnamWorldYemen, Rep.ZambiaZimbabwe Timeline:
This timeline shows a graph from 1961 to 2014 of OECD members. No data until 1960. Number of actual observations by date: 54.
Source name:
World Development Indicators
Source organization:
Carbon Dioxide Information Analysis Center, Environmental Sciences Division, Oak Ridge National Laboratory, Tennessee, United States.
Categories, topics:
Climate Change, Environment
Last updated:
apr 23, 2017
Indicators value changes by year
At the date of observation
Value
Absolute change
Change from previous value
jan 1, 1961
2.961
+2.961
0.0%
jan 1, 1962
2.945
-0.016
-0.55%
jan 1, 1963
2.922
-0.024
-0.8%
jan 1, 1964
2.901
-0.021
-0.7%
jan 1, 1965
2.906
+0.005
0.16%
jan 1, 1966
2.9
-0.005
-0.18%
jan 1, 1967
2.879
-0.022
-0.75%
jan 1, 1968
2.843
-0.036
-1.25%
jan 1, 1969
2.822
-0.021
-0.73%
jan 1, 1970
2.813
-0.009
-0.31%
jan 1, 1971
2.855
+0.042
1.49%
jan 1, 1972
2.841
-0.014
-0.49%
jan 1, 1973
2.829
-0.012
-0.42%
jan 1, 1974
2.813
-0.016
-0.57%
jan 1, 1975
2.782
-0.031
-1.1%
jan 1, 1976
2.752
-0.03
-1.09%
jan 1, 1977
2.722
-0.029
-1.06%
jan 1, 1978
2.708
-0.014
-0.53%
jan 1, 1979
2.695
-0.013
-0.49%
jan 1, 1980
2.706
+0.011
0.42%
jan 1, 1981
2.709
+0.002
0.09%
jan 1, 1982
2.673
-0.036
-1.33%
jan 1, 1983
2.646
-0.027
-1.01%
jan 1, 1984
2.625
-0.02
-0.77%
jan 1, 1985
2.588
-0.037
-1.41%
jan 1, 1986
2.561
-0.027
-1.05%
jan 1, 1987
2.534
-0.027
-1.07%
jan 1, 1988
2.525
-0.008
-0.33%
jan 1, 1989
2.524
-0.002
-0.07%
jan 1, 1990
2.544
+0.02
0.79%
jan 1, 1991
2.481
-0.063
-2.46%
jan 1, 1992
2.478
-0.002
-0.1%
jan 1, 1993
2.474
-0.004
-0.18%
jan 1, 1994
2.462
-0.012
-0.48%
jan 1, 1995
2.452
-0.01
-0.41%
jan 1, 1996
2.431
-0.022
-0.88%
jan 1, 1997
2.431
+0.0
0.01%
jan 1, 1998
2.432
+0.002
0.07%
jan 1, 1999
2.423
-0.01
-0.41%
jan 1, 2000
2.407
-0.015
-0.63%
jan 1, 2001
2.416
+0.009
0.37%
jan 1, 2002
2.413
-0.003
-0.13%
jan 1, 2003
2.409
-0.004
-0.16%
jan 1, 2004
2.414
+0.005
0.21%
jan 1, 2005
2.396
-0.018
-0.74%
jan 1, 2006
2.385
-0.012
-0.49%
jan 1, 2007
2.379
-0.005
-0.23%
jan 1, 2008
2.388
+0.009
0.36%
jan 1, 2009
2.374
-0.013
-0.56%
jan 1, 2010
2.332
-0.042
-1.76%
jan 1, 2011
2.323
-0.009
-0.39%
jan 1, 2012
2.335
+0.011
0.49%
jan 1, 2013
2.321
-0.014
-0.59%
jan 1, 2014
2.308
-0.013
-0.56%
Ranking of countries by current statistics by years


Comments: