29
/
en
AIzaSyAYiBZKx7MnpbEhh9jyipgxe19OcubqV5w
April 1, 2024
225707
Portugal
PRT
true
2
1
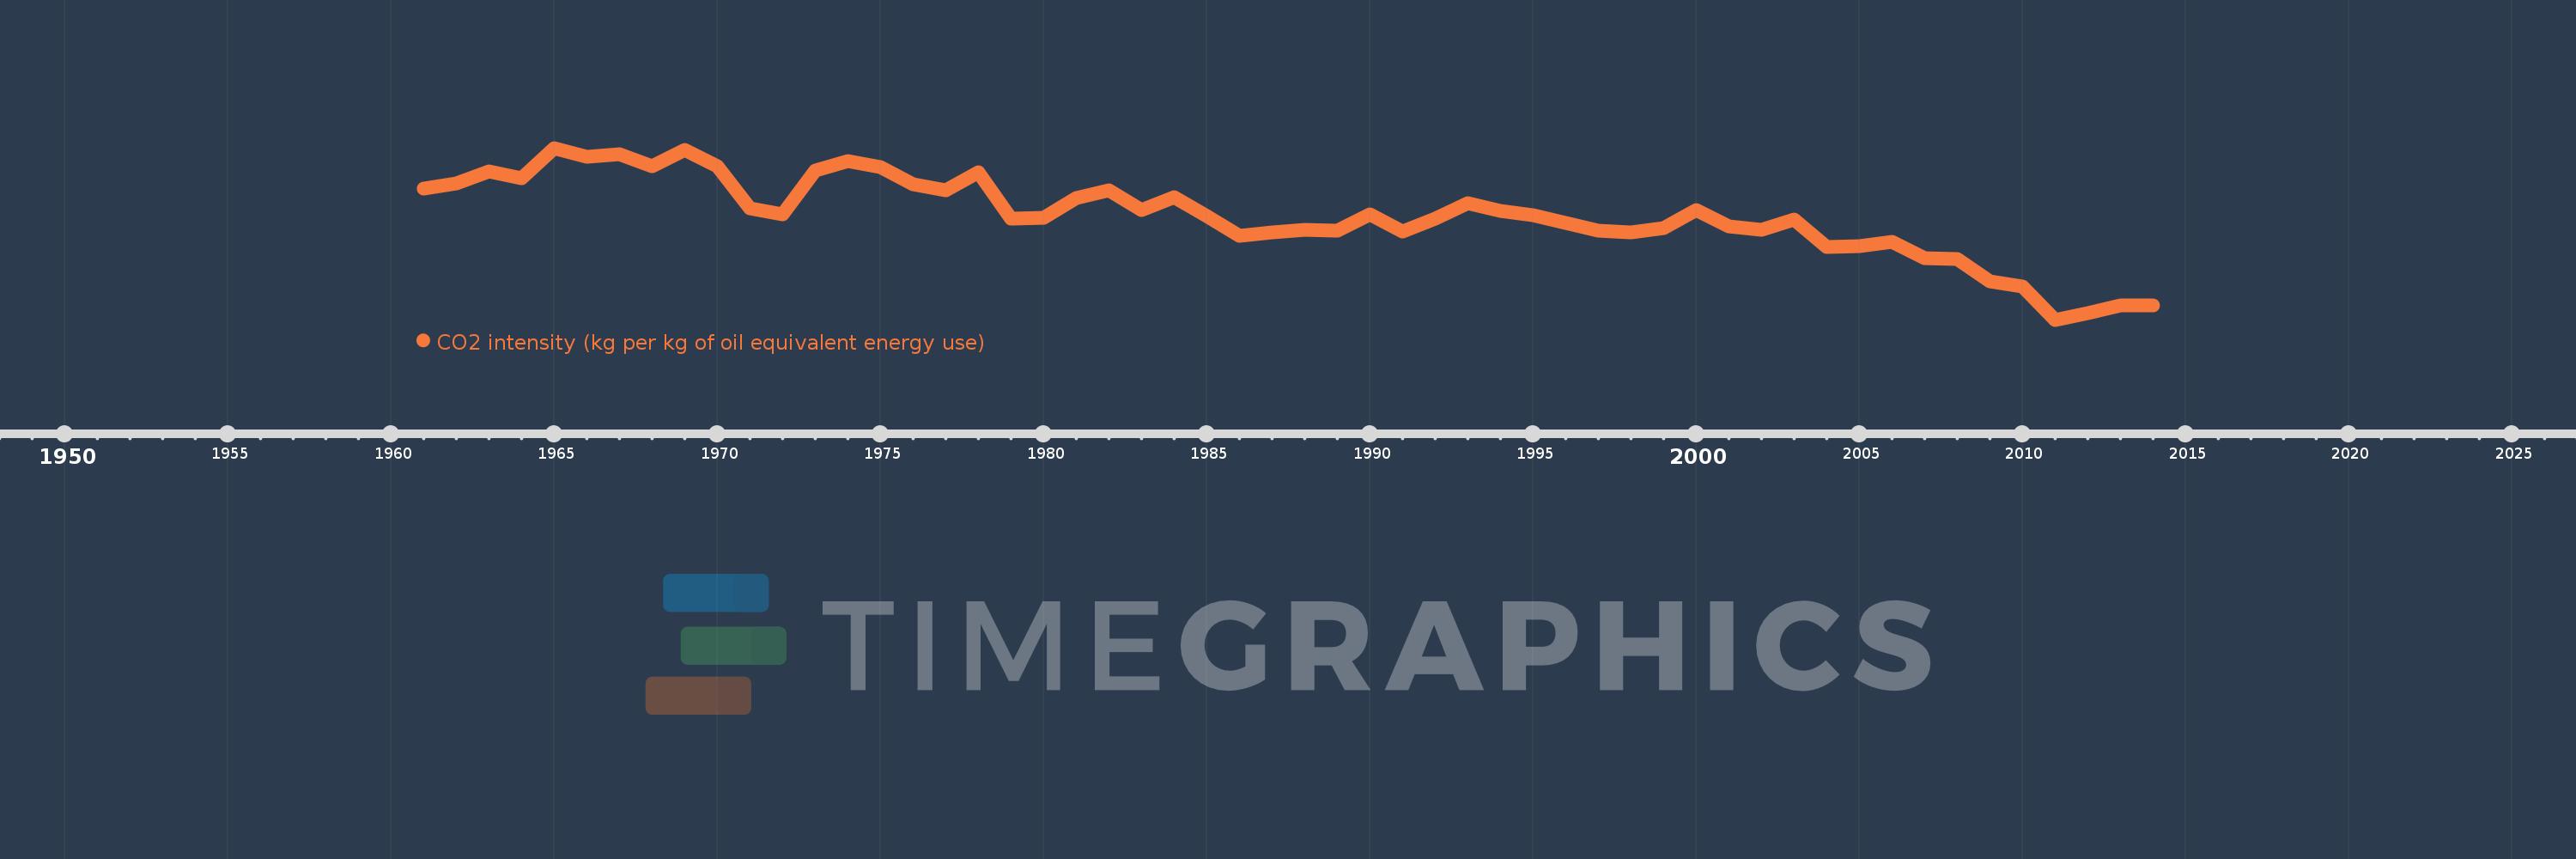
CO2 intensity (kg per kg of oil equivalent energy use)
2014,2013,2012,2011,2010,2009,2008,2007,2006,2005,2004,2003,2002,2001,2000,1999,1998,1997,1996,1995,1994,1993,1992,1991,1990,1989,1988,1987,1986,1985,1984,1983,1982,1981,1980,1979,1978,1977,1976,1975,1974,1973,1972,1971,1970,1969,1968,1967,1966,1965,1964,1963,1962,1961
This statistics in other country:
AlbaniaAlgeriaAngolaAntigua and BarbudaArab WorldArgentinaArmeniaAustraliaAustriaAzerbaijanBahamas, TheBahrainBangladeshBarbadosBelarusBelgiumBelizeBeninBhutanBoliviaBosnia and HerzegovinaBotswanaBrazilBrunei DarussalamBulgariaCabo VerdeCambodiaCameroonCanadaCaribbean small statesCentral Europe and the BalticsChileChinaColombiaComorosCongo, Dem. Rep.Congo, Rep.Costa RicaCote d'IvoireCroatiaCubaCuracaoCyprusCzech RepublicDenmarkDjiboutiDominicaDominican RepublicEarly-demographic dividendEast Asia & PacificEast Asia & Pacific (excluding high income)East Asia & Pacific (IDA & IBRD countries)EcuadorEgypt, Arab Rep.El SalvadorEquatorial GuineaEritreaEstoniaEthiopiaEuro areaEurope & Central AsiaEurope & Central Asia (excluding high income)Europe & Central Asia (IDA & IBRD countries)European UnionFijiFinlandFragile and conflict affected situationsFranceGabonGambia, TheGeorgiaGermanyGhanaGibraltarGreeceGrenadaGuatemalaGuinea-BissauGuyanaHaitiHeavily indebted poor countries (HIPC)High incomeHondurasHong Kong SAR, ChinaHungaryIBRD onlyIcelandIDA & IBRD totalIDA blendIDA onlyIDA totalIndiaIndonesiaIran, Islamic Rep.IraqIrelandIsraelItalyJamaicaJapanJordanKazakhstanKenyaKiribatiKorea, Dem. People’s Rep.Korea, Rep.KuwaitKyrgyz RepublicLate-demographic dividendLatin America & Caribbean Latin America & Caribbean (excluding high income)Latin America & the Caribbean (IDA & IBRD countries)LatviaLeast developed countries: UN classificationLebanonLesothoLibyaLithuaniaLow & middle incomeLow incomeLower middle incomeLuxembourgMacedonia, FYRMalaysiaMaldivesMaltaMarshall IslandsMauritiusMexicoMiddle East & North AfricaMiddle East & North Africa (excluding high income)Middle East & North Africa (IDA & IBRD countries)Middle incomeMoldovaMongoliaMontenegroMoroccoMozambiqueMyanmarNamibiaNepalNetherlandsNew ZealandNicaraguaNigerNigeriaNorth AmericaNorwayOECD membersOmanOther small statesPacific island small statesPakistanPalauPanamaParaguayPeruPhilippinesPolandPortugalPost-demographic dividendPre-demographic dividendQatarRomaniaRussian FederationSamoaSao Tome and PrincipeSaudi ArabiaSenegalSerbiaSeychellesSingaporeSlovak RepublicSloveniaSmall statesSolomon IslandsSouth AfricaSouth AsiaSouth Asia (IDA & IBRD)South SudanSpainSri LankaSt. Kitts and NevisSt. LuciaSt. Vincent and the GrenadinesSub-Saharan Africa Sub-Saharan Africa (excluding high income)Sub-Saharan Africa (IDA & IBRD countries)SudanSurinameSwazilandSwedenSwitzerlandSyrian Arab RepublicTajikistanTanzaniaThailandTimor-LesteTogoTongaTrinidad and TobagoTunisiaTurkeyTurkmenistanUkraineUnited Arab EmiratesUnited KingdomUnited StatesUpper middle incomeUruguayUzbekistanVanuatuVenezuela, RBVietnamWorldYemen, Rep.ZambiaZimbabwe Timeline:
This timeline shows a graph from 1961 to 2014 of Portugal. No data until 1960. Number of actual observations by date: 54.
Source name:
World Development Indicators
Source organization:
Carbon Dioxide Information Analysis Center, Environmental Sciences Division, Oak Ridge National Laboratory, Tennessee, United States.
Categories, topics:
Climate Change, Environment
Last updated:
apr 23, 2017
Indicators value changes by year
At the date of observation
Value
Absolute change
Change from previous value
jan 1, 1961
2.756
+2.756
0.0%
jan 1, 1962
2.783
+0.027
0.97%
jan 1, 1963
2.848
+0.065
2.35%
jan 1, 1964
2.811
-0.037
-1.3%
jan 1, 1965
2.974
+0.163
5.79%
jan 1, 1966
2.924
-0.05
-1.69%
jan 1, 1967
2.938
+0.014
0.48%
jan 1, 1968
2.874
-0.064
-2.17%
jan 1, 1969
2.962
+0.088
3.06%
jan 1, 1970
2.877
-0.085
-2.86%
jan 1, 1971
2.648
-0.229
-7.97%
jan 1, 1972
2.614
-0.034
-1.27%
jan 1, 1973
2.853
+0.239
9.13%
jan 1, 1974
2.901
+0.048
1.67%
jan 1, 1975
2.87
-0.03
-1.04%
jan 1, 1976
2.778
-0.092
-3.21%
jan 1, 1977
2.747
-0.031
-1.1%
jan 1, 1978
2.843
+0.096
3.49%
jan 1, 1979
2.595
-0.248
-8.72%
jan 1, 1980
2.596
+0.0
0.01%
jan 1, 1981
2.702
+0.107
4.11%
jan 1, 1982
2.746
+0.044
1.61%
jan 1, 1983
2.637
-0.109
-3.96%
jan 1, 1984
2.711
+0.074
2.8%
jan 1, 1985
2.606
-0.105
-3.89%
jan 1, 1986
2.5
-0.106
-4.07%
jan 1, 1987
2.517
+0.018
0.71%
jan 1, 1988
2.533
+0.016
0.63%
jan 1, 1989
2.529
-0.005
-0.18%
jan 1, 1990
2.614
+0.085
3.37%
jan 1, 1991
2.522
-0.092
-3.52%
jan 1, 1992
2.593
+0.071
2.82%
jan 1, 1993
2.674
+0.081
3.13%
jan 1, 1994
2.636
-0.038
-1.43%
jan 1, 1995
2.61
-0.026
-1.0%
jan 1, 1996
2.569
-0.041
-1.58%
jan 1, 1997
2.53
-0.039
-1.51%
jan 1, 1998
2.52
-0.01
-0.4%
jan 1, 1999
2.54
+0.021
0.82%
jan 1, 2000
2.638
+0.097
3.83%
jan 1, 2001
2.551
-0.087
-3.3%
jan 1, 2002
2.533
-0.018
-0.71%
jan 1, 2003
2.587
+0.055
2.16%
jan 1, 2004
2.438
-0.149
-5.77%
jan 1, 2005
2.445
+0.007
0.3%
jan 1, 2006
2.467
+0.022
0.89%
jan 1, 2007
2.378
-0.089
-3.61%
jan 1, 2008
2.375
-0.003
-0.15%
jan 1, 2009
2.254
-0.121
-5.08%
jan 1, 2010
2.225
-0.029
-1.29%
jan 1, 2011
2.048
-0.177
-7.93%
jan 1, 2012
2.085
+0.036
1.77%
jan 1, 2013
2.127
+0.042
2.02%
jan 1, 2014
2.124
-0.003
-0.12%
Ranking of countries by current statistics by years


Comments: