29
/
en
AIzaSyAYiBZKx7MnpbEhh9jyipgxe19OcubqV5w
April 1, 2024
221937
Peru
PER
true
2
1
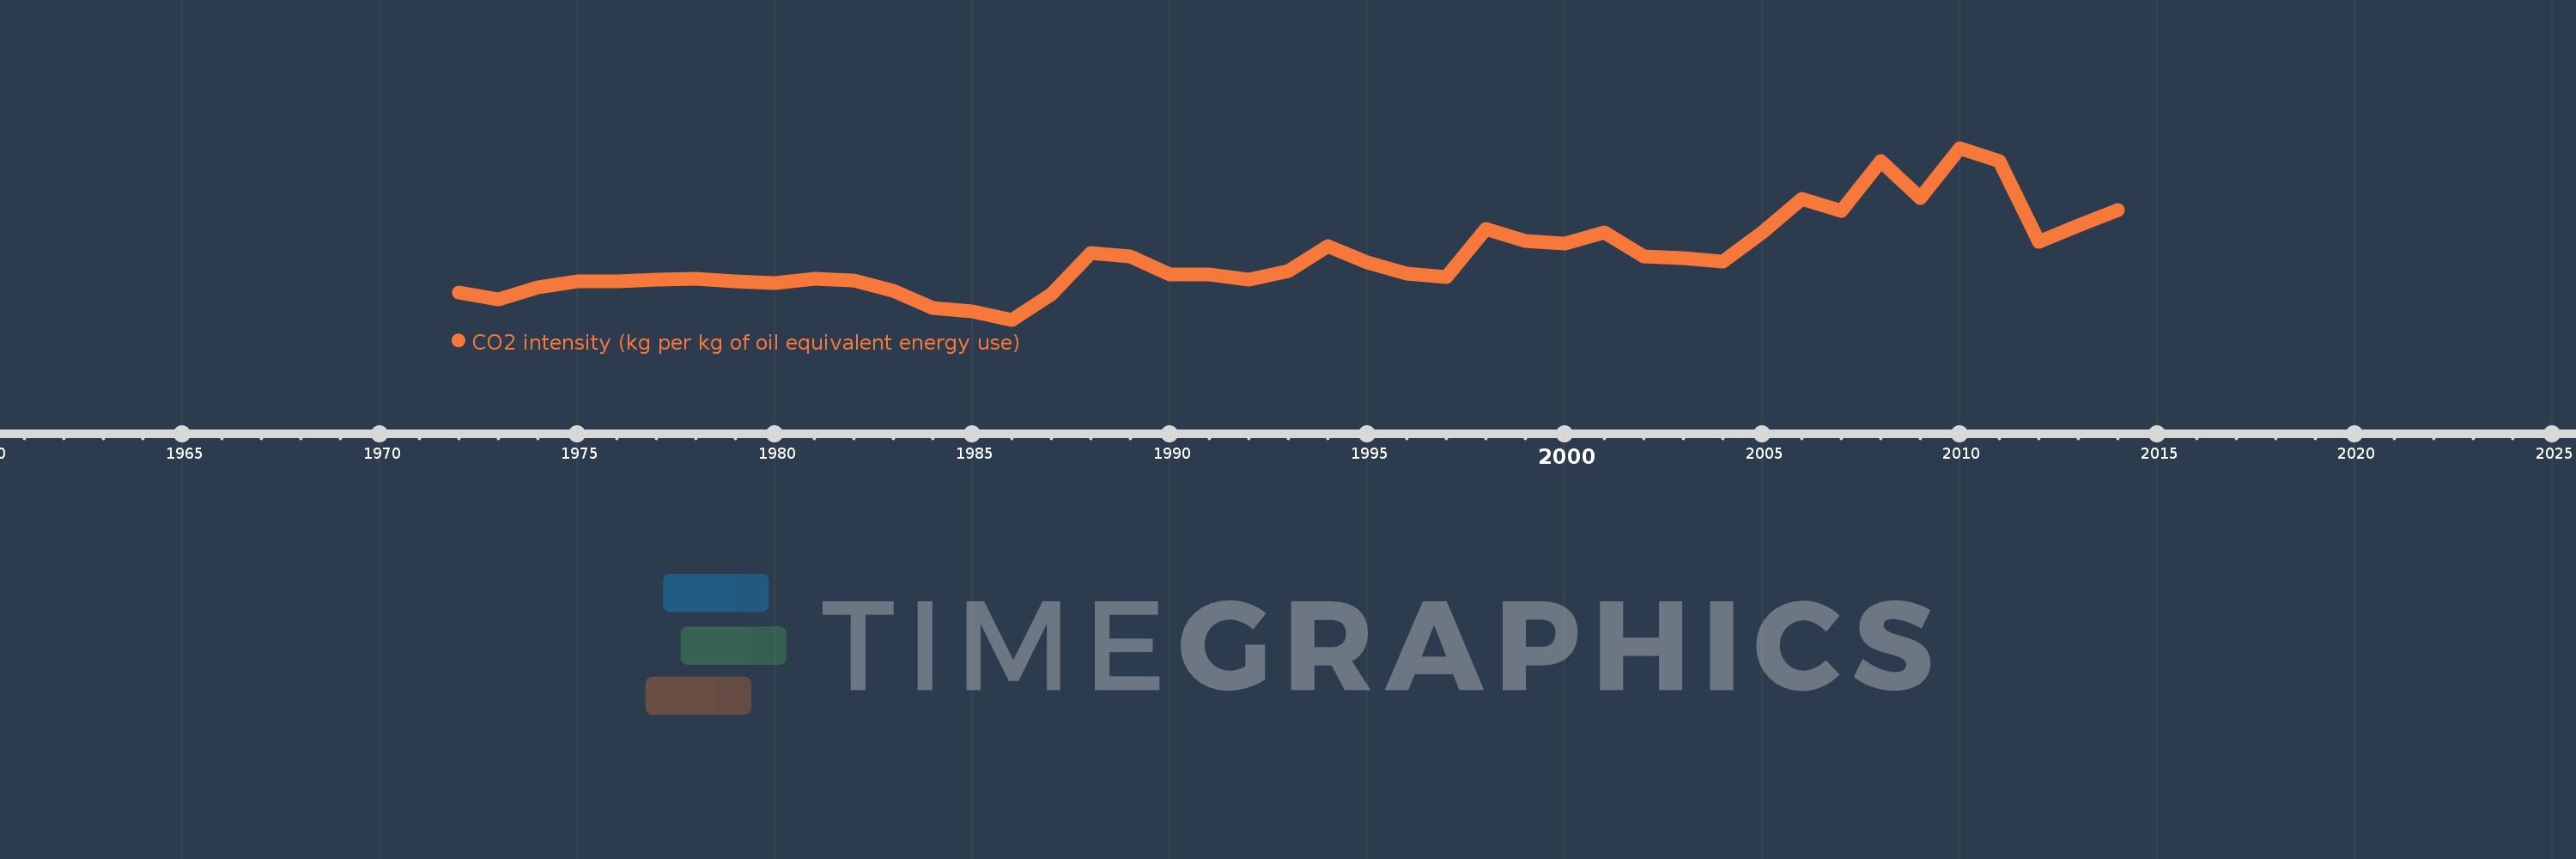
CO2 intensity (kg per kg of oil equivalent energy use)
2014,2013,2012,2011,2010,2009,2008,2007,2006,2005,2004,2003,2002,2001,2000,1999,1998,1997,1996,1995,1994,1993,1992,1991,1990,1989,1988,1987,1986,1985,1984,1983,1982,1981,1980,1979,1978,1977,1976,1975,1974,1973,1972
This statistics in other country:
AlbaniaAlgeriaAngolaAntigua and BarbudaArab WorldArgentinaArmeniaAustraliaAustriaAzerbaijanBahamas, TheBahrainBangladeshBarbadosBelarusBelgiumBelizeBeninBhutanBoliviaBosnia and HerzegovinaBotswanaBrazilBrunei DarussalamBulgariaCabo VerdeCambodiaCameroonCanadaCaribbean small statesCentral Europe and the BalticsChileChinaColombiaComorosCongo, Dem. Rep.Congo, Rep.Costa RicaCote d'IvoireCroatiaCubaCuracaoCyprusCzech RepublicDenmarkDjiboutiDominicaDominican RepublicEarly-demographic dividendEast Asia & PacificEast Asia & Pacific (excluding high income)East Asia & Pacific (IDA & IBRD countries)EcuadorEgypt, Arab Rep.El SalvadorEquatorial GuineaEritreaEstoniaEthiopiaEuro areaEurope & Central AsiaEurope & Central Asia (excluding high income)Europe & Central Asia (IDA & IBRD countries)European UnionFijiFinlandFragile and conflict affected situationsFranceGabonGambia, TheGeorgiaGermanyGhanaGibraltarGreeceGrenadaGuatemalaGuinea-BissauGuyanaHaitiHeavily indebted poor countries (HIPC)High incomeHondurasHong Kong SAR, ChinaHungaryIBRD onlyIcelandIDA & IBRD totalIDA blendIDA onlyIDA totalIndiaIndonesiaIran, Islamic Rep.IraqIrelandIsraelItalyJamaicaJapanJordanKazakhstanKenyaKiribatiKorea, Dem. People’s Rep.Korea, Rep.KuwaitKyrgyz RepublicLate-demographic dividendLatin America & Caribbean Latin America & Caribbean (excluding high income)Latin America & the Caribbean (IDA & IBRD countries)LatviaLeast developed countries: UN classificationLebanonLesothoLibyaLithuaniaLow & middle incomeLow incomeLower middle incomeLuxembourgMacedonia, FYRMalaysiaMaldivesMaltaMarshall IslandsMauritiusMexicoMiddle East & North AfricaMiddle East & North Africa (excluding high income)Middle East & North Africa (IDA & IBRD countries)Middle incomeMoldovaMongoliaMontenegroMoroccoMozambiqueMyanmarNamibiaNepalNetherlandsNew ZealandNicaraguaNigerNigeriaNorth AmericaNorwayOECD membersOmanOther small statesPacific island small statesPakistanPalauPanamaParaguayPeruPhilippinesPolandPortugalPost-demographic dividendPre-demographic dividendQatarRomaniaRussian FederationSamoaSao Tome and PrincipeSaudi ArabiaSenegalSerbiaSeychellesSingaporeSlovak RepublicSloveniaSmall statesSolomon IslandsSouth AfricaSouth AsiaSouth Asia (IDA & IBRD)South SudanSpainSri LankaSt. Kitts and NevisSt. LuciaSt. Vincent and the GrenadinesSub-Saharan Africa Sub-Saharan Africa (excluding high income)Sub-Saharan Africa (IDA & IBRD countries)SudanSurinameSwazilandSwedenSwitzerlandSyrian Arab RepublicTajikistanTanzaniaThailandTimor-LesteTogoTongaTrinidad and TobagoTunisiaTurkeyTurkmenistanUkraineUnited Arab EmiratesUnited KingdomUnited StatesUpper middle incomeUruguayUzbekistanVanuatuVenezuela, RBVietnamWorldYemen, Rep.ZambiaZimbabwe Timeline:
This timeline shows a graph from 1972 to 2014 of Peru. No data until 1971. Number of actual observations by date: 43.
Source name:
World Development Indicators
Source organization:
Carbon Dioxide Information Analysis Center, Environmental Sciences Division, Oak Ridge National Laboratory, Tennessee, United States.
Categories, topics:
Climate Change, Environment
Last updated:
apr 23, 2017
Indicators value changes by year
At the date of observation
Value
Absolute change
Change from previous value
jan 1, 1972
2.039
+2.039
0.0%
jan 1, 1973
1.99
-0.049
-2.39%
jan 1, 1974
2.077
+0.087
4.36%
jan 1, 1975
2.123
+0.046
2.19%
jan 1, 1976
2.121
-0.002
-0.08%
jan 1, 1977
2.134
+0.013
0.6%
jan 1, 1978
2.142
+0.008
0.37%
jan 1, 1979
2.123
-0.018
-0.86%
jan 1, 1980
2.113
-0.01
-0.49%
jan 1, 1981
2.143
+0.03
1.4%
jan 1, 1982
2.128
-0.015
-0.69%
jan 1, 1983
2.053
-0.075
-3.54%
jan 1, 1984
1.929
-0.124
-6.04%
jan 1, 1985
1.905
-0.024
-1.24%
jan 1, 1986
1.844
-0.061
-3.18%
jan 1, 1987
2.028
+0.183
9.94%
jan 1, 1988
2.33
+0.303
14.94%
jan 1, 1989
2.307
-0.023
-0.99%
jan 1, 1990
2.175
-0.133
-5.75%
jan 1, 1991
2.175
+0.0
0.0%
jan 1, 1992
2.138
-0.036
-1.68%
jan 1, 1993
2.195
+0.057
2.68%
jan 1, 1994
2.376
+0.181
8.23%
jan 1, 1995
2.262
-0.114
-4.8%
jan 1, 1996
2.177
-0.085
-3.76%
jan 1, 1997
2.156
-0.021
-0.95%
jan 1, 1998
2.506
+0.35
16.21%
jan 1, 1999
2.417
-0.089
-3.54%
jan 1, 2000
2.395
-0.022
-0.9%
jan 1, 2001
2.479
+0.084
3.5%
jan 1, 2002
2.303
-0.176
-7.09%
jan 1, 2003
2.29
-0.013
-0.58%
jan 1, 2004
2.267
-0.023
-1.0%
jan 1, 2005
2.477
+0.211
9.29%
jan 1, 2006
2.721
+0.244
9.85%
jan 1, 2007
2.633
-0.089
-3.26%
jan 1, 2008
2.997
+0.364
13.83%
jan 1, 2009
2.728
-0.269
-8.97%
jan 1, 2010
3.092
+0.364
13.33%
jan 1, 2011
2.998
-0.094
-3.03%
jan 1, 2012
2.407
-0.591
-19.7%
jan 1, 2013
2.526
+0.119
4.94%
jan 1, 2014
2.64
+0.114
4.5%
Ranking of countries by current statistics by years


Comments: