29
/
en
AIzaSyAYiBZKx7MnpbEhh9jyipgxe19OcubqV5w
April 1, 2024
195307
Mexico
MEX
true
2
1
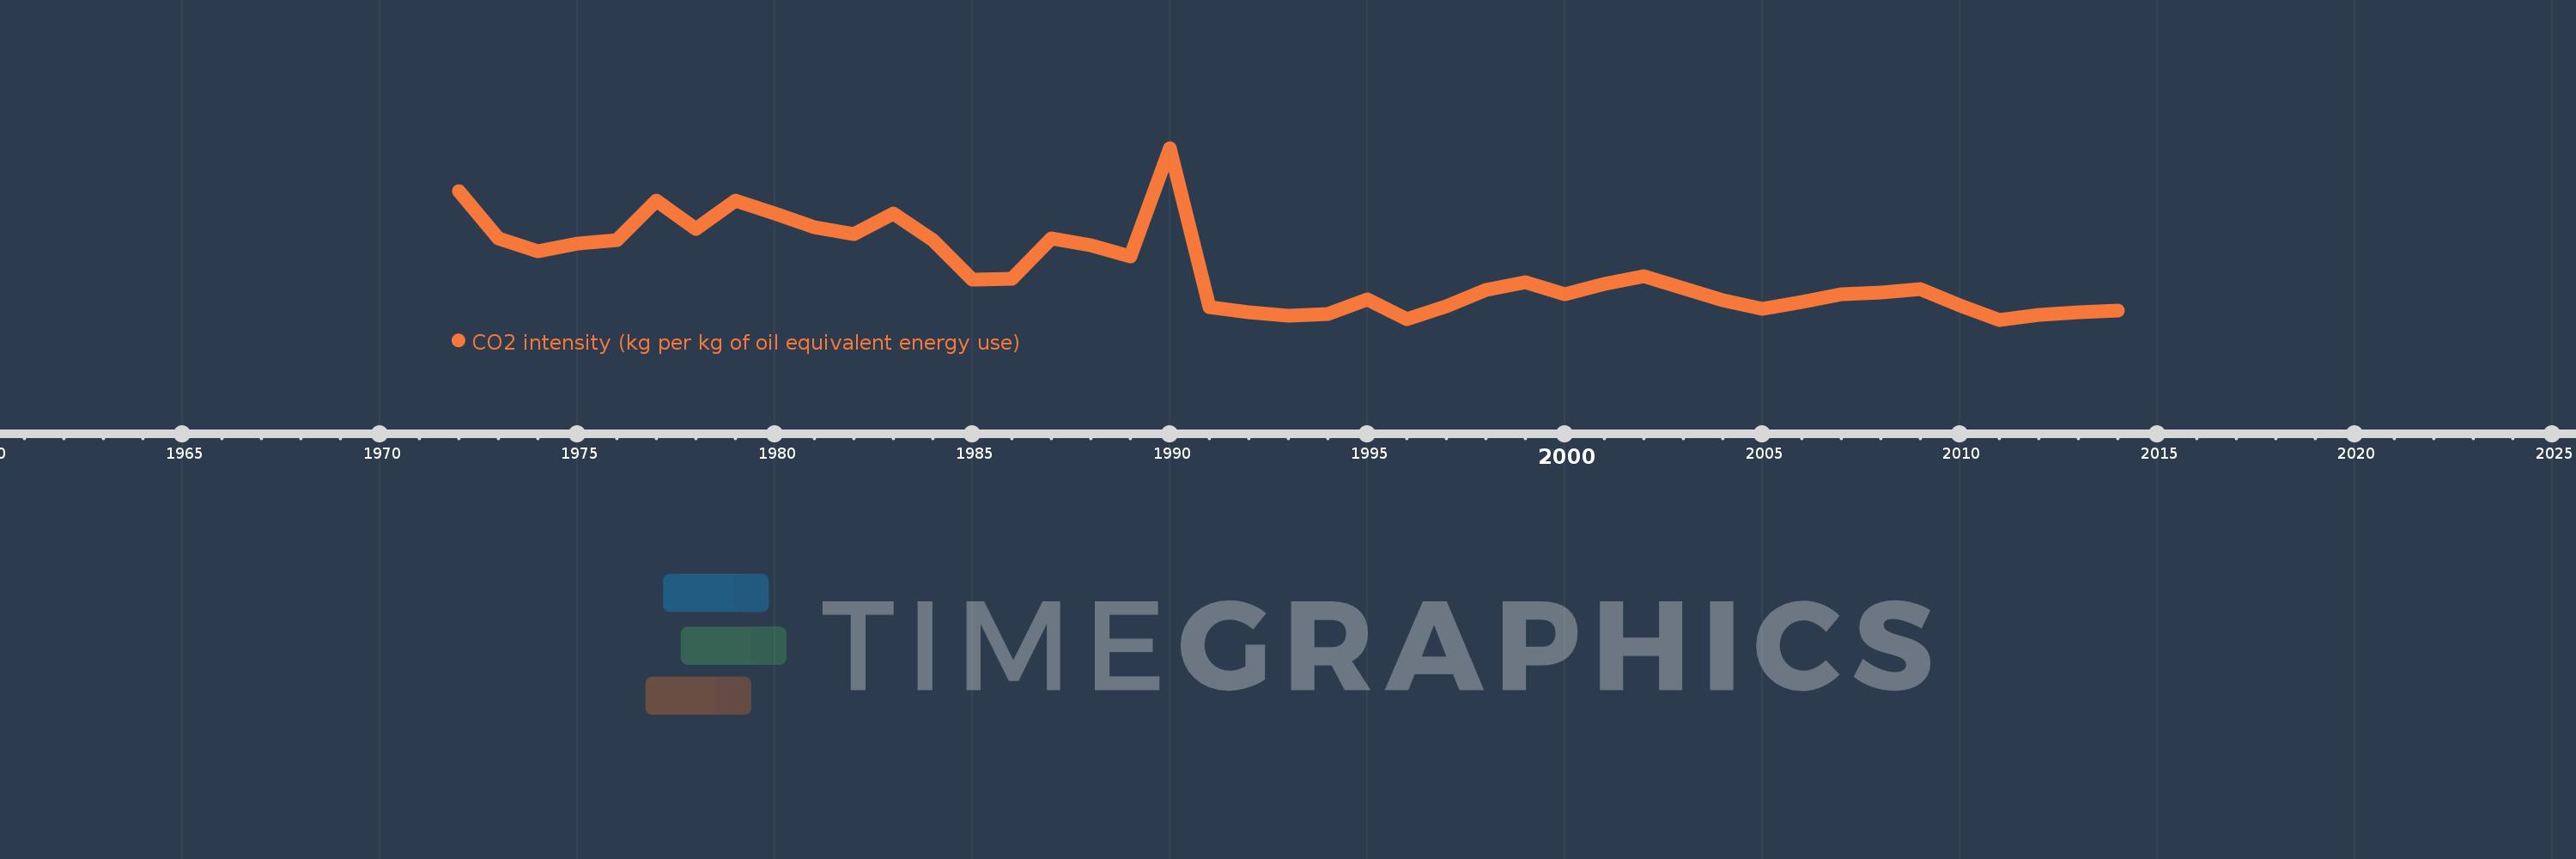
CO2 intensity (kg per kg of oil equivalent energy use)
2014,2013,2012,2011,2010,2009,2008,2007,2006,2005,2004,2003,2002,2001,2000,1999,1998,1997,1996,1995,1994,1993,1992,1991,1990,1989,1988,1987,1986,1985,1984,1983,1982,1981,1980,1979,1978,1977,1976,1975,1974,1973,1972
This statistics in other country:
AlbaniaAlgeriaAngolaAntigua and BarbudaArab WorldArgentinaArmeniaAustraliaAustriaAzerbaijanBahamas, TheBahrainBangladeshBarbadosBelarusBelgiumBelizeBeninBhutanBoliviaBosnia and HerzegovinaBotswanaBrazilBrunei DarussalamBulgariaCabo VerdeCambodiaCameroonCanadaCaribbean small statesCentral Europe and the BalticsChileChinaColombiaComorosCongo, Dem. Rep.Congo, Rep.Costa RicaCote d'IvoireCroatiaCubaCuracaoCyprusCzech RepublicDenmarkDjiboutiDominicaDominican RepublicEarly-demographic dividendEast Asia & PacificEast Asia & Pacific (excluding high income)East Asia & Pacific (IDA & IBRD countries)EcuadorEgypt, Arab Rep.El SalvadorEquatorial GuineaEritreaEstoniaEthiopiaEuro areaEurope & Central AsiaEurope & Central Asia (excluding high income)Europe & Central Asia (IDA & IBRD countries)European UnionFijiFinlandFragile and conflict affected situationsFranceGabonGambia, TheGeorgiaGermanyGhanaGibraltarGreeceGrenadaGuatemalaGuinea-BissauGuyanaHaitiHeavily indebted poor countries (HIPC)High incomeHondurasHong Kong SAR, ChinaHungaryIBRD onlyIcelandIDA & IBRD totalIDA blendIDA onlyIDA totalIndiaIndonesiaIran, Islamic Rep.IraqIrelandIsraelItalyJamaicaJapanJordanKazakhstanKenyaKiribatiKorea, Dem. People’s Rep.Korea, Rep.KuwaitKyrgyz RepublicLate-demographic dividendLatin America & Caribbean Latin America & Caribbean (excluding high income)Latin America & the Caribbean (IDA & IBRD countries)LatviaLeast developed countries: UN classificationLebanonLesothoLibyaLithuaniaLow & middle incomeLow incomeLower middle incomeLuxembourgMacedonia, FYRMalaysiaMaldivesMaltaMarshall IslandsMauritiusMexicoMiddle East & North AfricaMiddle East & North Africa (excluding high income)Middle East & North Africa (IDA & IBRD countries)Middle incomeMoldovaMongoliaMontenegroMoroccoMozambiqueMyanmarNamibiaNepalNetherlandsNew ZealandNicaraguaNigerNigeriaNorth AmericaNorwayOECD membersOmanOther small statesPacific island small statesPakistanPalauPanamaParaguayPeruPhilippinesPolandPortugalPost-demographic dividendPre-demographic dividendQatarRomaniaRussian FederationSamoaSao Tome and PrincipeSaudi ArabiaSenegalSerbiaSeychellesSingaporeSlovak RepublicSloveniaSmall statesSolomon IslandsSouth AfricaSouth AsiaSouth Asia (IDA & IBRD)South SudanSpainSri LankaSt. Kitts and NevisSt. LuciaSt. Vincent and the GrenadinesSub-Saharan Africa Sub-Saharan Africa (excluding high income)Sub-Saharan Africa (IDA & IBRD countries)SudanSurinameSwazilandSwedenSwitzerlandSyrian Arab RepublicTajikistanTanzaniaThailandTimor-LesteTogoTongaTrinidad and TobagoTunisiaTurkeyTurkmenistanUkraineUnited Arab EmiratesUnited KingdomUnited StatesUpper middle incomeUruguayUzbekistanVanuatuVenezuela, RBVietnamWorldYemen, Rep.ZambiaZimbabwe Timeline:
This timeline shows a graph from 1972 to 2014 of Mexico. No data until 1971. Number of actual observations by date: 43.
Source name:
World Development Indicators
Source organization:
Carbon Dioxide Information Analysis Center, Environmental Sciences Division, Oak Ridge National Laboratory, Tennessee, United States.
Categories, topics:
Climate Change, Environment
Last updated:
apr 23, 2017
Indicators value changes by year
At the date of observation
Value
Absolute change
Change from previous value
jan 1, 1972
2.94
+2.94
0.0%
jan 1, 1973
2.787
-0.153
-5.22%
jan 1, 1974
2.746
-0.041
-1.47%
jan 1, 1975
2.771
+0.026
0.94%
jan 1, 1976
2.781
+0.01
0.35%
jan 1, 1977
2.909
+0.129
4.62%
jan 1, 1978
2.818
-0.092
-3.15%
jan 1, 1979
2.909
+0.091
3.25%
jan 1, 1980
2.869
-0.04
-1.39%
jan 1, 1981
2.822
-0.046
-1.61%
jan 1, 1982
2.802
-0.021
-0.74%
jan 1, 1983
2.868
+0.066
2.37%
jan 1, 1984
2.782
-0.086
-2.99%
jan 1, 1985
2.655
-0.127
-4.57%
jan 1, 1986
2.656
+0.001
0.04%
jan 1, 1987
2.788
+0.131
4.95%
jan 1, 1988
2.766
-0.022
-0.79%
jan 1, 1989
2.73
-0.036
-1.3%
jan 1, 1990
3.079
+0.35
12.81%
jan 1, 1991
2.566
-0.514
-16.69%
jan 1, 1992
2.549
-0.016
-0.64%
jan 1, 1993
2.539
-0.01
-0.41%
jan 1, 1994
2.543
+0.004
0.15%
jan 1, 1995
2.592
+0.05
1.95%
jan 1, 1996
2.527
-0.066
-2.53%
jan 1, 1997
2.568
+0.041
1.63%
jan 1, 1998
2.621
+0.053
2.08%
jan 1, 1999
2.645
+0.024
0.91%
jan 1, 2000
2.608
-0.037
-1.4%
jan 1, 2001
2.641
+0.034
1.29%
jan 1, 2002
2.665
+0.023
0.89%
jan 1, 2003
2.627
-0.038
-1.42%
jan 1, 2004
2.588
-0.039
-1.48%
jan 1, 2005
2.56
-0.028
-1.08%
jan 1, 2006
2.581
+0.021
0.82%
jan 1, 2007
2.606
+0.025
0.95%
jan 1, 2008
2.614
+0.009
0.33%
jan 1, 2009
2.624
+0.009
0.36%
jan 1, 2010
2.571
-0.053
-2.02%
jan 1, 2011
2.525
-0.045
-1.76%
jan 1, 2012
2.542
+0.017
0.67%
jan 1, 2013
2.549
+0.007
0.26%
jan 1, 2014
2.554
+0.006
0.22%
Ranking of countries by current statistics by years


Comments: