29
/
en
AIzaSyAYiBZKx7MnpbEhh9jyipgxe19OcubqV5w
April 1, 2024
154352
India
IND
true
2
1
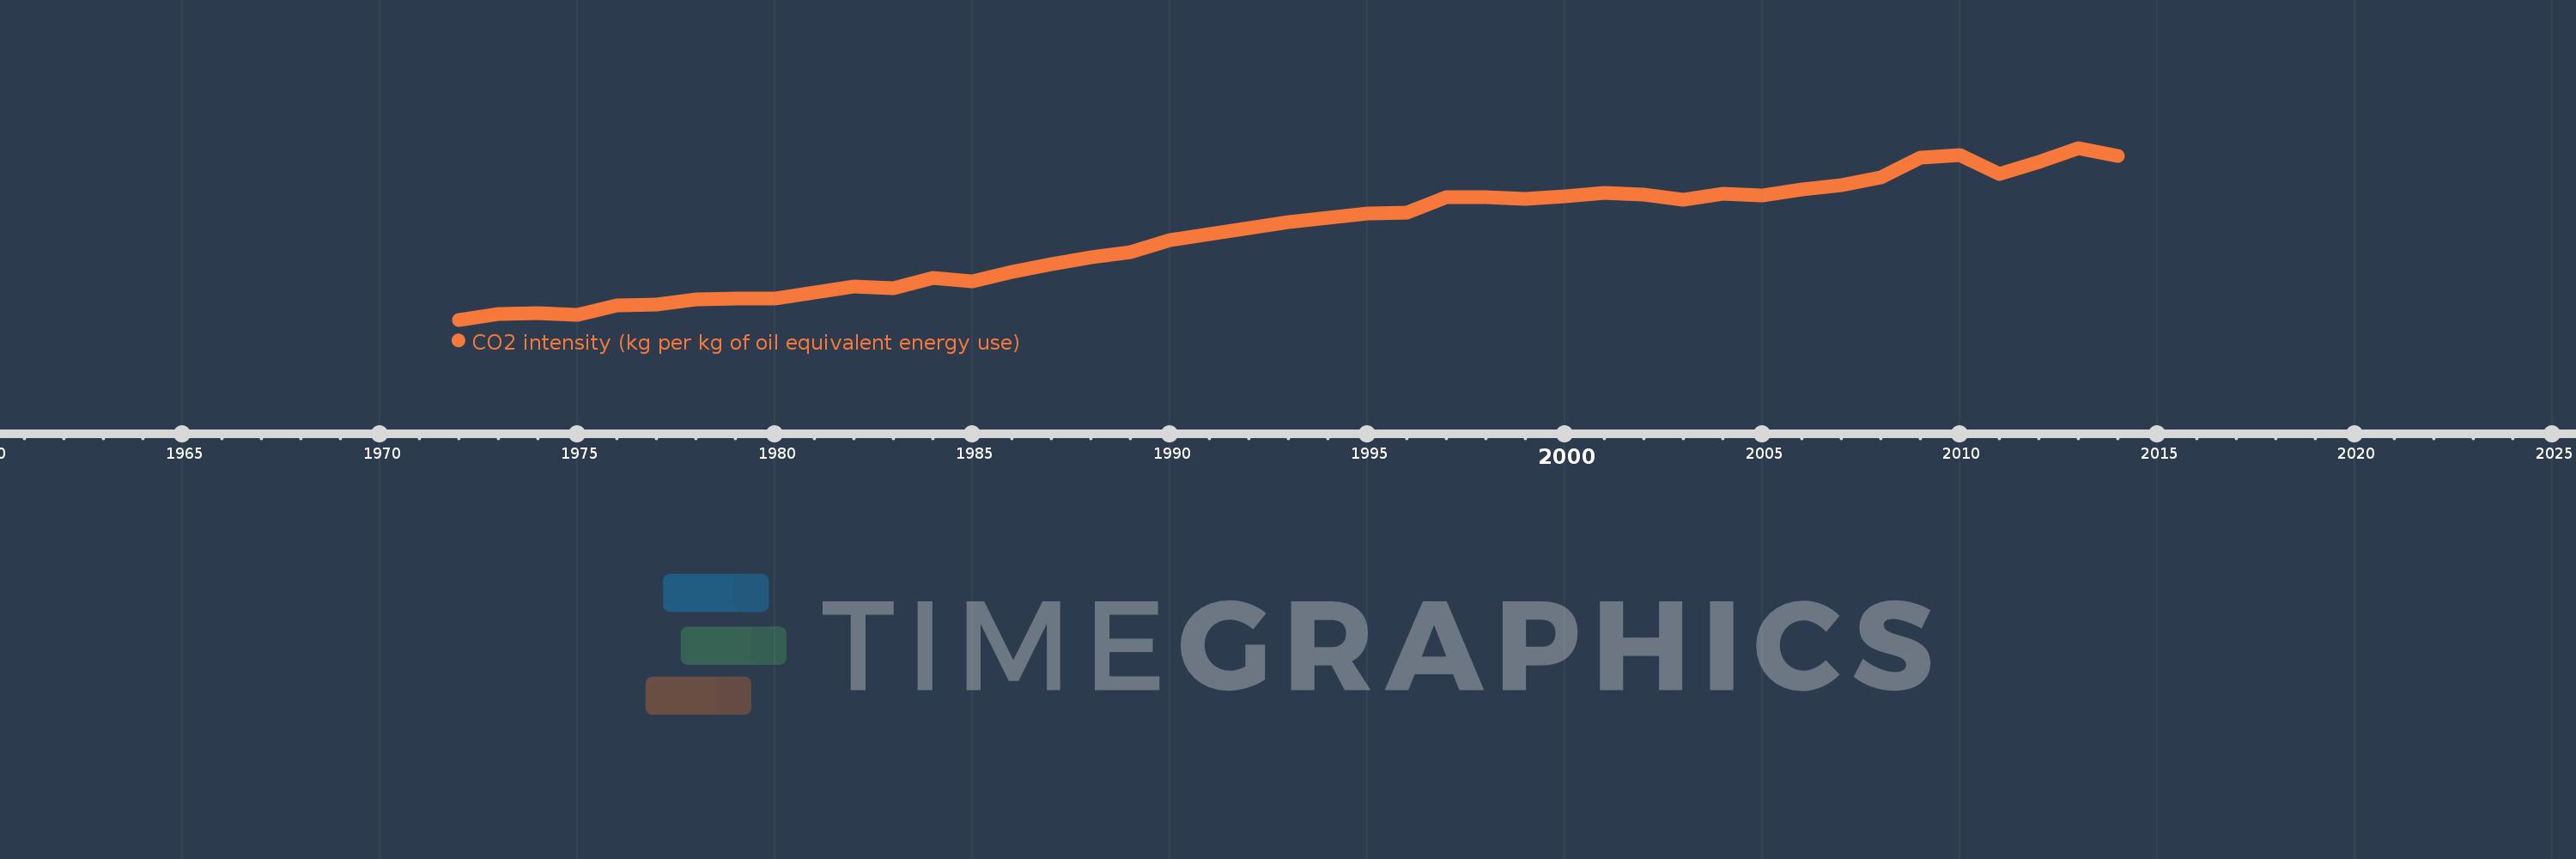
CO2 intensity (kg per kg of oil equivalent energy use)
2014,2013,2012,2011,2010,2009,2008,2007,2006,2005,2004,2003,2002,2001,2000,1999,1998,1997,1996,1995,1994,1993,1992,1991,1990,1989,1988,1987,1986,1985,1984,1983,1982,1981,1980,1979,1978,1977,1976,1975,1974,1973,1972
This statistics in other country:
AlbaniaAlgeriaAngolaAntigua and BarbudaArab WorldArgentinaArmeniaAustraliaAustriaAzerbaijanBahamas, TheBahrainBangladeshBarbadosBelarusBelgiumBelizeBeninBhutanBoliviaBosnia and HerzegovinaBotswanaBrazilBrunei DarussalamBulgariaCabo VerdeCambodiaCameroonCanadaCaribbean small statesCentral Europe and the BalticsChileChinaColombiaComorosCongo, Dem. Rep.Congo, Rep.Costa RicaCote d'IvoireCroatiaCubaCuracaoCyprusCzech RepublicDenmarkDjiboutiDominicaDominican RepublicEarly-demographic dividendEast Asia & PacificEast Asia & Pacific (excluding high income)East Asia & Pacific (IDA & IBRD countries)EcuadorEgypt, Arab Rep.El SalvadorEquatorial GuineaEritreaEstoniaEthiopiaEuro areaEurope & Central AsiaEurope & Central Asia (excluding high income)Europe & Central Asia (IDA & IBRD countries)European UnionFijiFinlandFragile and conflict affected situationsFranceGabonGambia, TheGeorgiaGermanyGhanaGibraltarGreeceGrenadaGuatemalaGuinea-BissauGuyanaHaitiHeavily indebted poor countries (HIPC)High incomeHondurasHong Kong SAR, ChinaHungaryIBRD onlyIcelandIDA & IBRD totalIDA blendIDA onlyIDA totalIndiaIndonesiaIran, Islamic Rep.IraqIrelandIsraelItalyJamaicaJapanJordanKazakhstanKenyaKiribatiKorea, Dem. People’s Rep.Korea, Rep.KuwaitKyrgyz RepublicLate-demographic dividendLatin America & Caribbean Latin America & Caribbean (excluding high income)Latin America & the Caribbean (IDA & IBRD countries)LatviaLeast developed countries: UN classificationLebanonLesothoLibyaLithuaniaLow & middle incomeLow incomeLower middle incomeLuxembourgMacedonia, FYRMalaysiaMaldivesMaltaMarshall IslandsMauritiusMexicoMiddle East & North AfricaMiddle East & North Africa (excluding high income)Middle East & North Africa (IDA & IBRD countries)Middle incomeMoldovaMongoliaMontenegroMoroccoMozambiqueMyanmarNamibiaNepalNetherlandsNew ZealandNicaraguaNigerNigeriaNorth AmericaNorwayOECD membersOmanOther small statesPacific island small statesPakistanPalauPanamaParaguayPeruPhilippinesPolandPortugalPost-demographic dividendPre-demographic dividendQatarRomaniaRussian FederationSamoaSao Tome and PrincipeSaudi ArabiaSenegalSerbiaSeychellesSingaporeSlovak RepublicSloveniaSmall statesSolomon IslandsSouth AfricaSouth AsiaSouth Asia (IDA & IBRD)South SudanSpainSri LankaSt. Kitts and NevisSt. LuciaSt. Vincent and the GrenadinesSub-Saharan Africa Sub-Saharan Africa (excluding high income)Sub-Saharan Africa (IDA & IBRD countries)SudanSurinameSwazilandSwedenSwitzerlandSyrian Arab RepublicTajikistanTanzaniaThailandTimor-LesteTogoTongaTrinidad and TobagoTunisiaTurkeyTurkmenistanUkraineUnited Arab EmiratesUnited KingdomUnited StatesUpper middle incomeUruguayUzbekistanVanuatuVenezuela, RBVietnamWorldYemen, Rep.ZambiaZimbabwe Timeline:
This timeline shows a graph from 1972 to 2014 of India. No data until 1971. Number of actual observations by date: 43.
Source name:
World Development Indicators
Source organization:
Carbon Dioxide Information Analysis Center, Environmental Sciences Division, Oak Ridge National Laboratory, Tennessee, United States.
Categories, topics:
Climate Change, Environment
Last updated:
apr 23, 2017
Indicators value changes by year
At the date of observation
Value
Absolute change
Change from previous value
jan 1, 1972
1.353
+1.353
0.0%
jan 1, 1973
1.399
+0.046
3.42%
jan 1, 1974
1.401
+0.002
0.14%
jan 1, 1975
1.394
-0.007
-0.52%
jan 1, 1976
1.463
+0.069
4.97%
jan 1, 1977
1.472
+0.008
0.55%
jan 1, 1978
1.513
+0.042
2.85%
jan 1, 1979
1.515
+0.002
0.1%
jan 1, 1980
1.519
+0.004
0.27%
jan 1, 1981
1.566
+0.047
3.12%
jan 1, 1982
1.609
+0.042
2.69%
jan 1, 1983
1.598
-0.01
-0.65%
jan 1, 1984
1.676
+0.078
4.88%
jan 1, 1985
1.649
-0.027
-1.59%
jan 1, 1986
1.723
+0.074
4.46%
jan 1, 1987
1.785
+0.062
3.58%
jan 1, 1988
1.835
+0.05
2.82%
jan 1, 1989
1.879
+0.044
2.42%
jan 1, 1990
1.97
+0.09
4.81%
jan 1, 1991
2.019
+0.05
2.52%
jan 1, 1992
2.066
+0.047
2.33%
jan 1, 1993
2.111
+0.044
2.14%
jan 1, 1994
2.143
+0.032
1.53%
jan 1, 1995
2.173
+0.03
1.41%
jan 1, 1996
2.186
+0.012
0.57%
jan 1, 1997
2.3
+0.114
5.23%
jan 1, 1998
2.305
+0.005
0.2%
jan 1, 1999
2.287
-0.018
-0.77%
jan 1, 2000
2.31
+0.023
1.02%
jan 1, 2001
2.338
+0.028
1.2%
jan 1, 2002
2.32
-0.018
-0.75%
jan 1, 2003
2.283
-0.037
-1.61%
jan 1, 2004
2.331
+0.048
2.1%
jan 1, 2005
2.318
-0.013
-0.55%
jan 1, 2006
2.362
+0.044
1.88%
jan 1, 2007
2.394
+0.033
1.38%
jan 1, 2008
2.454
+0.059
2.48%
jan 1, 2009
2.612
+0.159
6.46%
jan 1, 2010
2.626
+0.014
0.53%
jan 1, 2011
2.483
-0.143
-5.46%
jan 1, 2012
2.578
+0.095
3.83%
jan 1, 2013
2.684
+0.107
4.14%
jan 1, 2014
2.624
-0.06
-2.25%
Ranking of countries by current statistics by years


Comments: