29
/
en
AIzaSyAYiBZKx7MnpbEhh9jyipgxe19OcubqV5w
April 1, 2024
34820
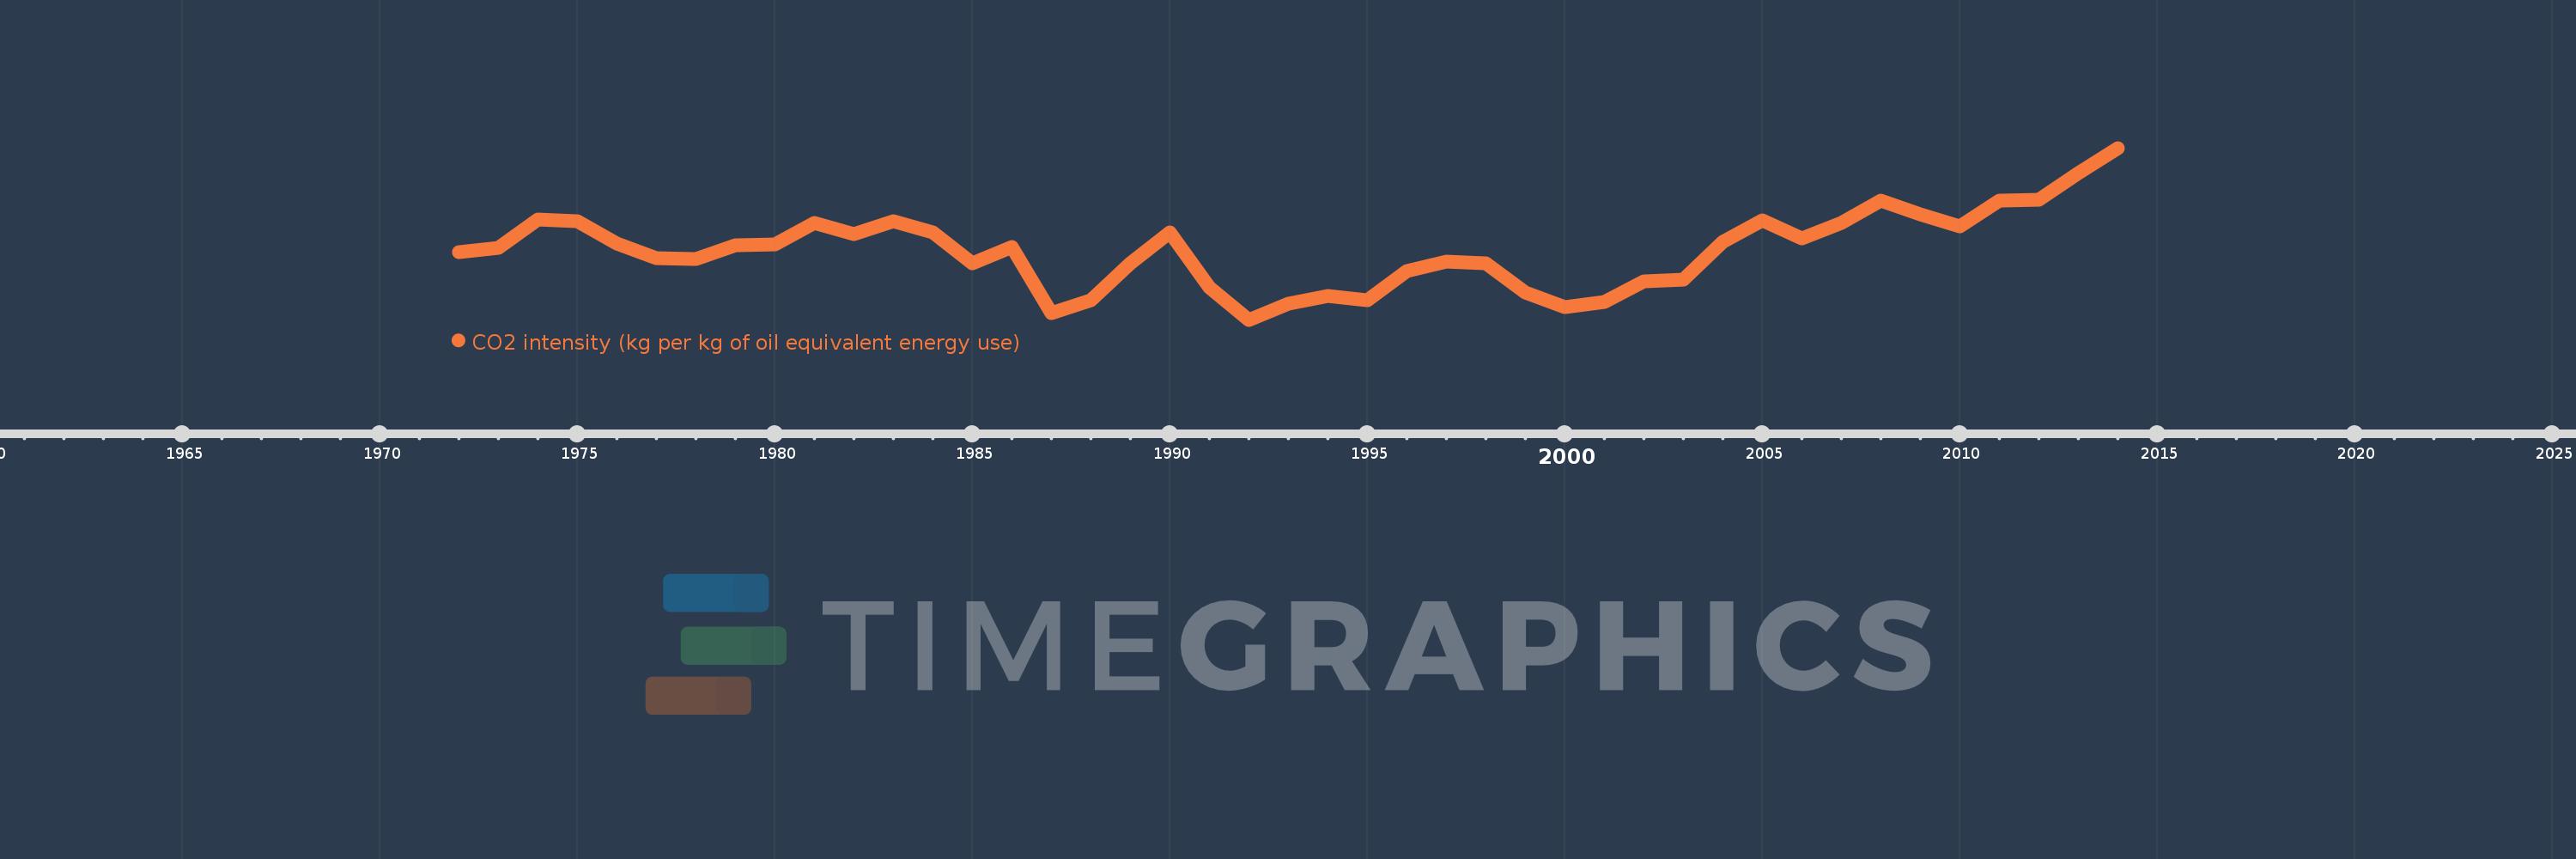
Heavily indebted poor countries (HIPC)
HPC
false
2
1
CO2 intensity (kg per kg of oil equivalent energy use)
2014,2013,2012,2011,2010,2009,2008,2007,2006,2005,2004,2003,2002,2001,2000,1999,1998,1997,1996,1995,1994,1993,1992,1991,1990,1989,1988,1987,1986,1985,1984,1983,1982,1981,1980,1979,1978,1977,1976,1975,1974,1973,1972
This statistics in other country:
AlbaniaAlgeriaAngolaAntigua and BarbudaArab WorldArgentinaArmeniaAustraliaAustriaAzerbaijanBahamas, TheBahrainBangladeshBarbadosBelarusBelgiumBelizeBeninBhutanBoliviaBosnia and HerzegovinaBotswanaBrazilBrunei DarussalamBulgariaCabo VerdeCambodiaCameroonCanadaCaribbean small statesCentral Europe and the BalticsChileChinaColombiaComorosCongo, Dem. Rep.Congo, Rep.Costa RicaCote d'IvoireCroatiaCubaCuracaoCyprusCzech RepublicDenmarkDjiboutiDominicaDominican RepublicEarly-demographic dividendEast Asia & PacificEast Asia & Pacific (excluding high income)East Asia & Pacific (IDA & IBRD countries)EcuadorEgypt, Arab Rep.El SalvadorEquatorial GuineaEritreaEstoniaEthiopiaEuro areaEurope & Central AsiaEurope & Central Asia (excluding high income)Europe & Central Asia (IDA & IBRD countries)European UnionFijiFinlandFragile and conflict affected situationsFranceGabonGambia, TheGeorgiaGermanyGhanaGibraltarGreeceGrenadaGuatemalaGuinea-BissauGuyanaHaitiHeavily indebted poor countries (HIPC)High incomeHondurasHong Kong SAR, ChinaHungaryIBRD onlyIcelandIDA & IBRD totalIDA blendIDA onlyIDA totalIndiaIndonesiaIran, Islamic Rep.IraqIrelandIsraelItalyJamaicaJapanJordanKazakhstanKenyaKiribatiKorea, Dem. People’s Rep.Korea, Rep.KuwaitKyrgyz RepublicLate-demographic dividendLatin America & Caribbean Latin America & Caribbean (excluding high income)Latin America & the Caribbean (IDA & IBRD countries)LatviaLeast developed countries: UN classificationLebanonLesothoLibyaLithuaniaLow & middle incomeLow incomeLower middle incomeLuxembourgMacedonia, FYRMalaysiaMaldivesMaltaMarshall IslandsMauritiusMexicoMiddle East & North AfricaMiddle East & North Africa (excluding high income)Middle East & North Africa (IDA & IBRD countries)Middle incomeMoldovaMongoliaMontenegroMoroccoMozambiqueMyanmarNamibiaNepalNetherlandsNew ZealandNicaraguaNigerNigeriaNorth AmericaNorwayOECD membersOmanOther small statesPacific island small statesPakistanPalauPanamaParaguayPeruPhilippinesPolandPortugalPost-demographic dividendPre-demographic dividendQatarRomaniaRussian FederationSamoaSao Tome and PrincipeSaudi ArabiaSenegalSerbiaSeychellesSingaporeSlovak RepublicSloveniaSmall statesSolomon IslandsSouth AfricaSouth AsiaSouth Asia (IDA & IBRD)South SudanSpainSri LankaSt. Kitts and NevisSt. LuciaSt. Vincent and the GrenadinesSub-Saharan Africa Sub-Saharan Africa (excluding high income)Sub-Saharan Africa (IDA & IBRD countries)SudanSurinameSwazilandSwedenSwitzerlandSyrian Arab RepublicTajikistanTanzaniaThailandTimor-LesteTogoTongaTrinidad and TobagoTunisiaTurkeyTurkmenistanUkraineUnited Arab EmiratesUnited KingdomUnited StatesUpper middle incomeUruguayUzbekistanVanuatuVenezuela, RBVietnamWorldYemen, Rep.ZambiaZimbabwe Timeline:
This timeline shows a graph from 1972 to 2014 of Heavily indebted poor countries (HIPC). No data until 1971. Number of actual observations by date: 43.
Source name:
World Development Indicators
Source organization:
Carbon Dioxide Information Analysis Center, Environmental Sciences Division, Oak Ridge National Laboratory, Tennessee, United States.
Categories, topics:
Climate Change, Environment
Last updated:
apr 23, 2017
Indicators value changes by year
At the date of observation
Value
Absolute change
Change from previous value
jan 1, 1972
0.561
+0.561
0.0%
jan 1, 1973
0.567
+0.006
1.08%
jan 1, 1974
0.603
+0.037
6.45%
jan 1, 1975
0.6
-0.003
-0.56%
jan 1, 1976
0.572
-0.028
-4.73%
jan 1, 1977
0.554
-0.018
-3.13%
jan 1, 1978
0.553
-0.001
-0.17%
jan 1, 1979
0.57
+0.017
3.15%
jan 1, 1980
0.571
+0.0
0.08%
jan 1, 1981
0.598
+0.027
4.72%
jan 1, 1982
0.584
-0.014
-2.34%
jan 1, 1983
0.6
+0.016
2.78%
jan 1, 1984
0.586
-0.014
-2.29%
jan 1, 1985
0.547
-0.039
-6.64%
jan 1, 1986
0.568
+0.021
3.86%
jan 1, 1987
0.484
-0.084
-14.81%
jan 1, 1988
0.501
+0.017
3.58%
jan 1, 1989
0.547
+0.046
9.15%
jan 1, 1990
0.586
+0.039
7.1%
jan 1, 1991
0.517
-0.069
-11.83%
jan 1, 1992
0.476
-0.041
-7.85%
jan 1, 1993
0.496
+0.02
4.1%
jan 1, 1994
0.506
+0.01
2.1%
jan 1, 1995
0.501
-0.005
-0.99%
jan 1, 1996
0.538
+0.037
7.31%
jan 1, 1997
0.549
+0.011
2.08%
jan 1, 1998
0.547
-0.002
-0.28%
jan 1, 1999
0.51
-0.037
-6.81%
jan 1, 2000
0.492
-0.018
-3.49%
jan 1, 2001
0.498
+0.006
1.17%
jan 1, 2002
0.524
+0.026
5.16%
jan 1, 2003
0.527
+0.003
0.56%
jan 1, 2004
0.574
+0.048
9.03%
jan 1, 2005
0.602
+0.027
4.73%
jan 1, 2006
0.579
-0.022
-3.67%
jan 1, 2007
0.598
+0.019
3.29%
jan 1, 2008
0.627
+0.028
4.69%
jan 1, 2009
0.609
-0.018
-2.88%
jan 1, 2010
0.594
-0.015
-2.42%
jan 1, 2011
0.626
+0.033
5.49%
jan 1, 2012
0.628
+0.001
0.22%
jan 1, 2013
0.661
+0.033
5.23%
jan 1, 2014
0.693
+0.032
4.91%
Ranking of countries by current statistics by years


Comments: