29
/
en
AIzaSyAYiBZKx7MnpbEhh9jyipgxe19OcubqV5w
April 1, 2024
203934
Myanmar
MMR
true
2
1
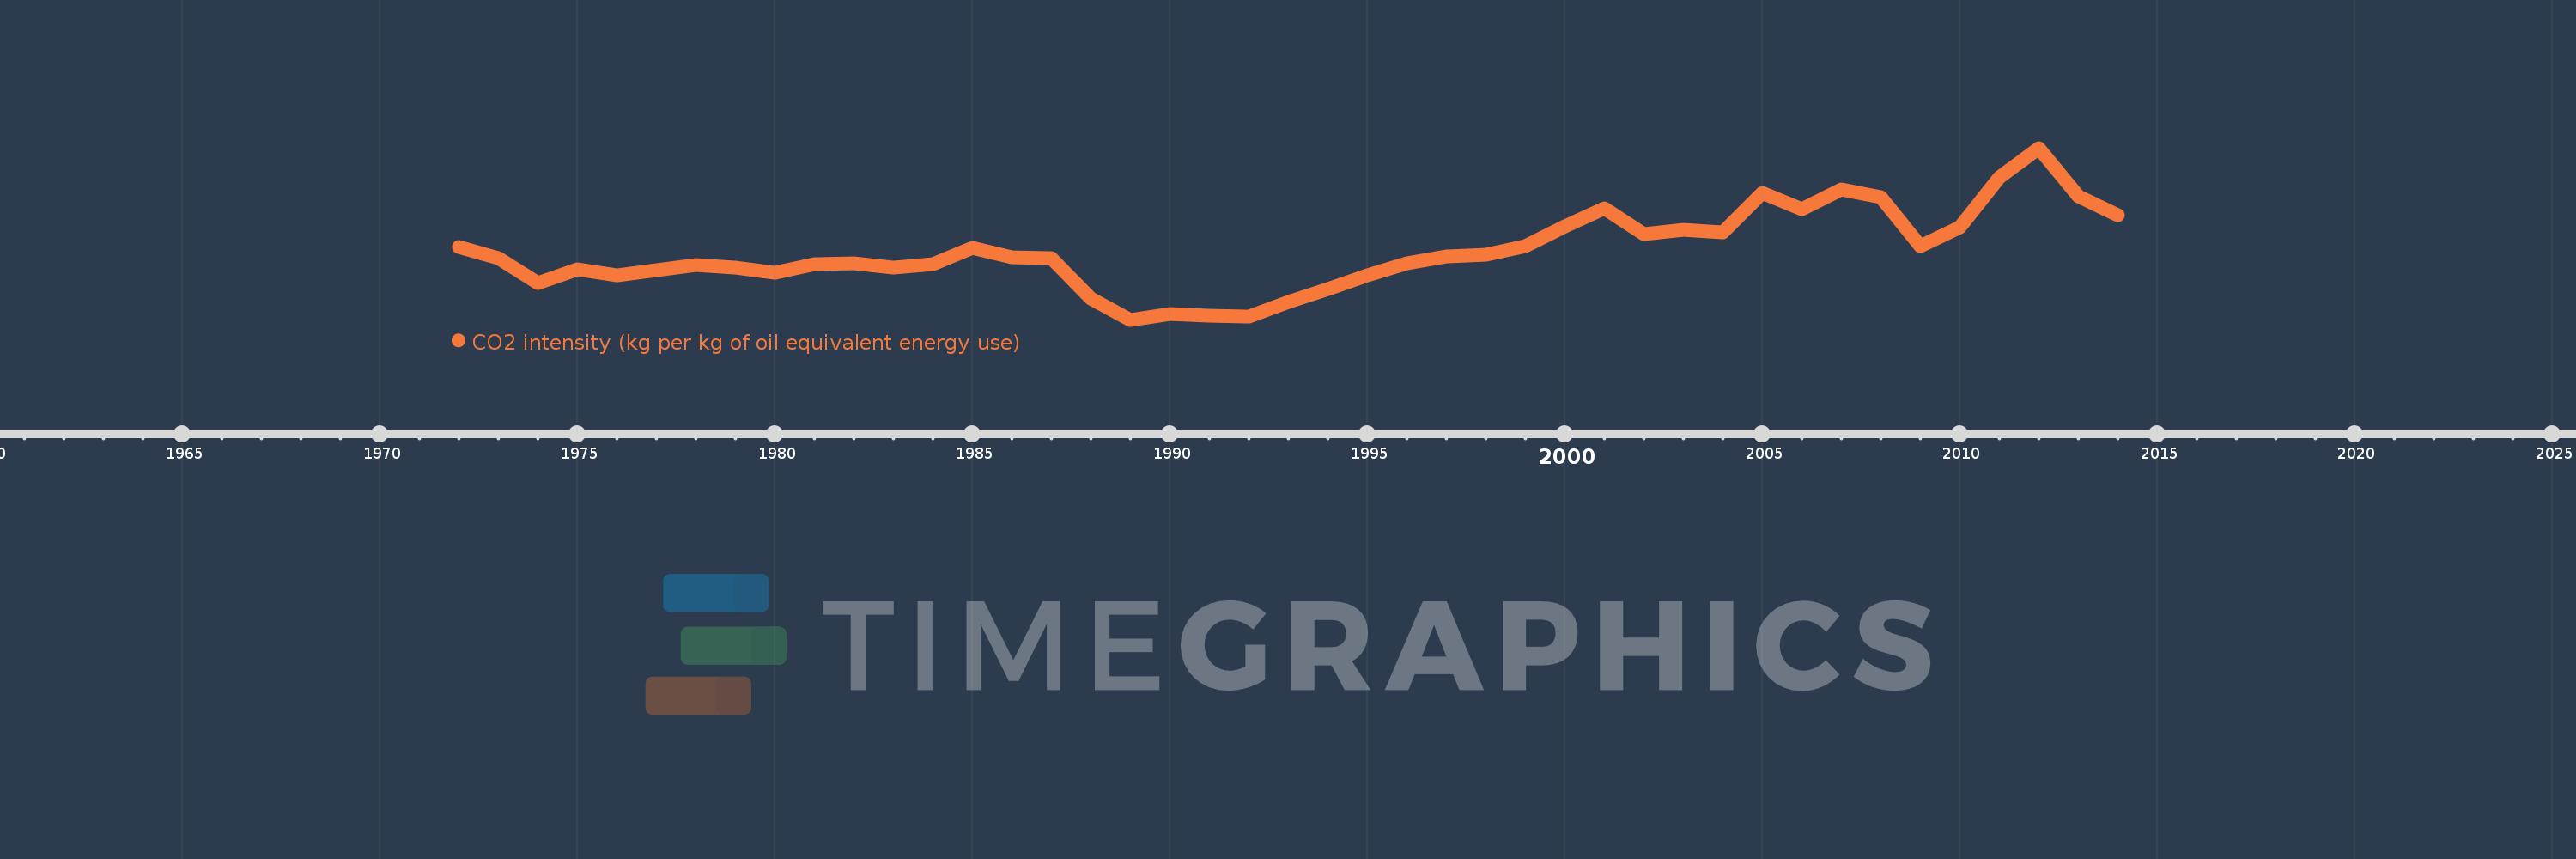
CO2 intensity (kg per kg of oil equivalent energy use)
2014,2013,2012,2011,2010,2009,2008,2007,2006,2005,2004,2003,2002,2001,2000,1999,1998,1997,1996,1995,1994,1993,1992,1991,1990,1989,1988,1987,1986,1985,1984,1983,1982,1981,1980,1979,1978,1977,1976,1975,1974,1973,1972
This statistics in other country:
AlbaniaAlgeriaAngolaAntigua and BarbudaArab WorldArgentinaArmeniaAustraliaAustriaAzerbaijanBahamas, TheBahrainBangladeshBarbadosBelarusBelgiumBelizeBeninBhutanBoliviaBosnia and HerzegovinaBotswanaBrazilBrunei DarussalamBulgariaCabo VerdeCambodiaCameroonCanadaCaribbean small statesCentral Europe and the BalticsChileChinaColombiaComorosCongo, Dem. Rep.Congo, Rep.Costa RicaCote d'IvoireCroatiaCubaCuracaoCyprusCzech RepublicDenmarkDjiboutiDominicaDominican RepublicEarly-demographic dividendEast Asia & PacificEast Asia & Pacific (excluding high income)East Asia & Pacific (IDA & IBRD countries)EcuadorEgypt, Arab Rep.El SalvadorEquatorial GuineaEritreaEstoniaEthiopiaEuro areaEurope & Central AsiaEurope & Central Asia (excluding high income)Europe & Central Asia (IDA & IBRD countries)European UnionFijiFinlandFragile and conflict affected situationsFranceGabonGambia, TheGeorgiaGermanyGhanaGibraltarGreeceGrenadaGuatemalaGuinea-BissauGuyanaHaitiHeavily indebted poor countries (HIPC)High incomeHondurasHong Kong SAR, ChinaHungaryIBRD onlyIcelandIDA & IBRD totalIDA blendIDA onlyIDA totalIndiaIndonesiaIran, Islamic Rep.IraqIrelandIsraelItalyJamaicaJapanJordanKazakhstanKenyaKiribatiKorea, Dem. People’s Rep.Korea, Rep.KuwaitKyrgyz RepublicLate-demographic dividendLatin America & Caribbean Latin America & Caribbean (excluding high income)Latin America & the Caribbean (IDA & IBRD countries)LatviaLeast developed countries: UN classificationLebanonLesothoLibyaLithuaniaLow & middle incomeLow incomeLower middle incomeLuxembourgMacedonia, FYRMalaysiaMaldivesMaltaMarshall IslandsMauritiusMexicoMiddle East & North AfricaMiddle East & North Africa (excluding high income)Middle East & North Africa (IDA & IBRD countries)Middle incomeMoldovaMongoliaMontenegroMoroccoMozambiqueMyanmarNamibiaNepalNetherlandsNew ZealandNicaraguaNigerNigeriaNorth AmericaNorwayOECD membersOmanOther small statesPacific island small statesPakistanPalauPanamaParaguayPeruPhilippinesPolandPortugalPost-demographic dividendPre-demographic dividendQatarRomaniaRussian FederationSamoaSao Tome and PrincipeSaudi ArabiaSenegalSerbiaSeychellesSingaporeSlovak RepublicSloveniaSmall statesSolomon IslandsSouth AfricaSouth AsiaSouth Asia (IDA & IBRD)South SudanSpainSri LankaSt. Kitts and NevisSt. LuciaSt. Vincent and the GrenadinesSub-Saharan Africa Sub-Saharan Africa (excluding high income)Sub-Saharan Africa (IDA & IBRD countries)SudanSurinameSwazilandSwedenSwitzerlandSyrian Arab RepublicTajikistanTanzaniaThailandTimor-LesteTogoTongaTrinidad and TobagoTunisiaTurkeyTurkmenistanUkraineUnited Arab EmiratesUnited KingdomUnited StatesUpper middle incomeUruguayUzbekistanVanuatuVenezuela, RBVietnamWorldYemen, Rep.ZambiaZimbabwe Timeline:
This timeline shows a graph from 1972 to 2014 of Myanmar. No data until 1971. Number of actual observations by date: 43.
Source name:
World Development Indicators
Source organization:
Carbon Dioxide Information Analysis Center, Environmental Sciences Division, Oak Ridge National Laboratory, Tennessee, United States.
Categories, topics:
Climate Change, Environment
Last updated:
apr 23, 2017
Indicators value changes by year
At the date of observation
Value
Absolute change
Change from previous value
jan 1, 1972
0.646
+0.646
0.0%
jan 1, 1973
0.609
-0.036
-5.63%
jan 1, 1974
0.519
-0.09
-14.79%
jan 1, 1975
0.567
+0.048
9.27%
jan 1, 1976
0.547
-0.02
-3.53%
jan 1, 1977
0.564
+0.016
2.98%
jan 1, 1978
0.583
+0.019
3.42%
jan 1, 1979
0.573
-0.009
-1.62%
jan 1, 1980
0.556
-0.017
-2.97%
jan 1, 1981
0.587
+0.03
5.4%
jan 1, 1982
0.59
+0.004
0.62%
jan 1, 1983
0.574
-0.016
-2.73%
jan 1, 1984
0.585
+0.011
1.87%
jan 1, 1985
0.643
+0.058
9.89%
jan 1, 1986
0.611
-0.032
-4.98%
jan 1, 1987
0.606
-0.005
-0.78%
jan 1, 1988
0.462
-0.144
-23.76%
jan 1, 1989
0.387
-0.075
-16.32%
jan 1, 1990
0.408
+0.021
5.56%
jan 1, 1991
0.4
-0.008
-1.87%
jan 1, 1992
0.398
-0.002
-0.57%
jan 1, 1993
0.451
+0.053
13.41%
jan 1, 1994
0.497
+0.046
10.19%
jan 1, 1995
0.547
+0.05
9.96%
jan 1, 1996
0.589
+0.042
7.75%
jan 1, 1997
0.613
+0.024
4.07%
jan 1, 1998
0.621
+0.007
1.21%
jan 1, 1999
0.651
+0.03
4.88%
jan 1, 2000
0.72
+0.069
10.65%
jan 1, 2001
0.786
+0.065
9.05%
jan 1, 2002
0.695
-0.09
-11.5%
jan 1, 2003
0.71
+0.015
2.11%
jan 1, 2004
0.7
-0.01
-1.4%
jan 1, 2005
0.84
+0.14
20.01%
jan 1, 2006
0.782
-0.058
-6.91%
jan 1, 2007
0.855
+0.073
9.3%
jan 1, 2008
0.825
-0.03
-3.51%
jan 1, 2009
0.651
-0.173
-21.01%
jan 1, 2010
0.718
+0.066
10.16%
jan 1, 2011
0.896
+0.179
24.88%
jan 1, 2012
1.002
+0.106
11.78%
jan 1, 2013
0.829
-0.173
-17.29%
jan 1, 2014
0.761
-0.068
-8.2%
Ranking of countries by current statistics by years


Comments: