29
/
en
AIzaSyAYiBZKx7MnpbEhh9jyipgxe19OcubqV5w
April 1, 2024
27137
East Asia & Pacific
EAS
false
2
1
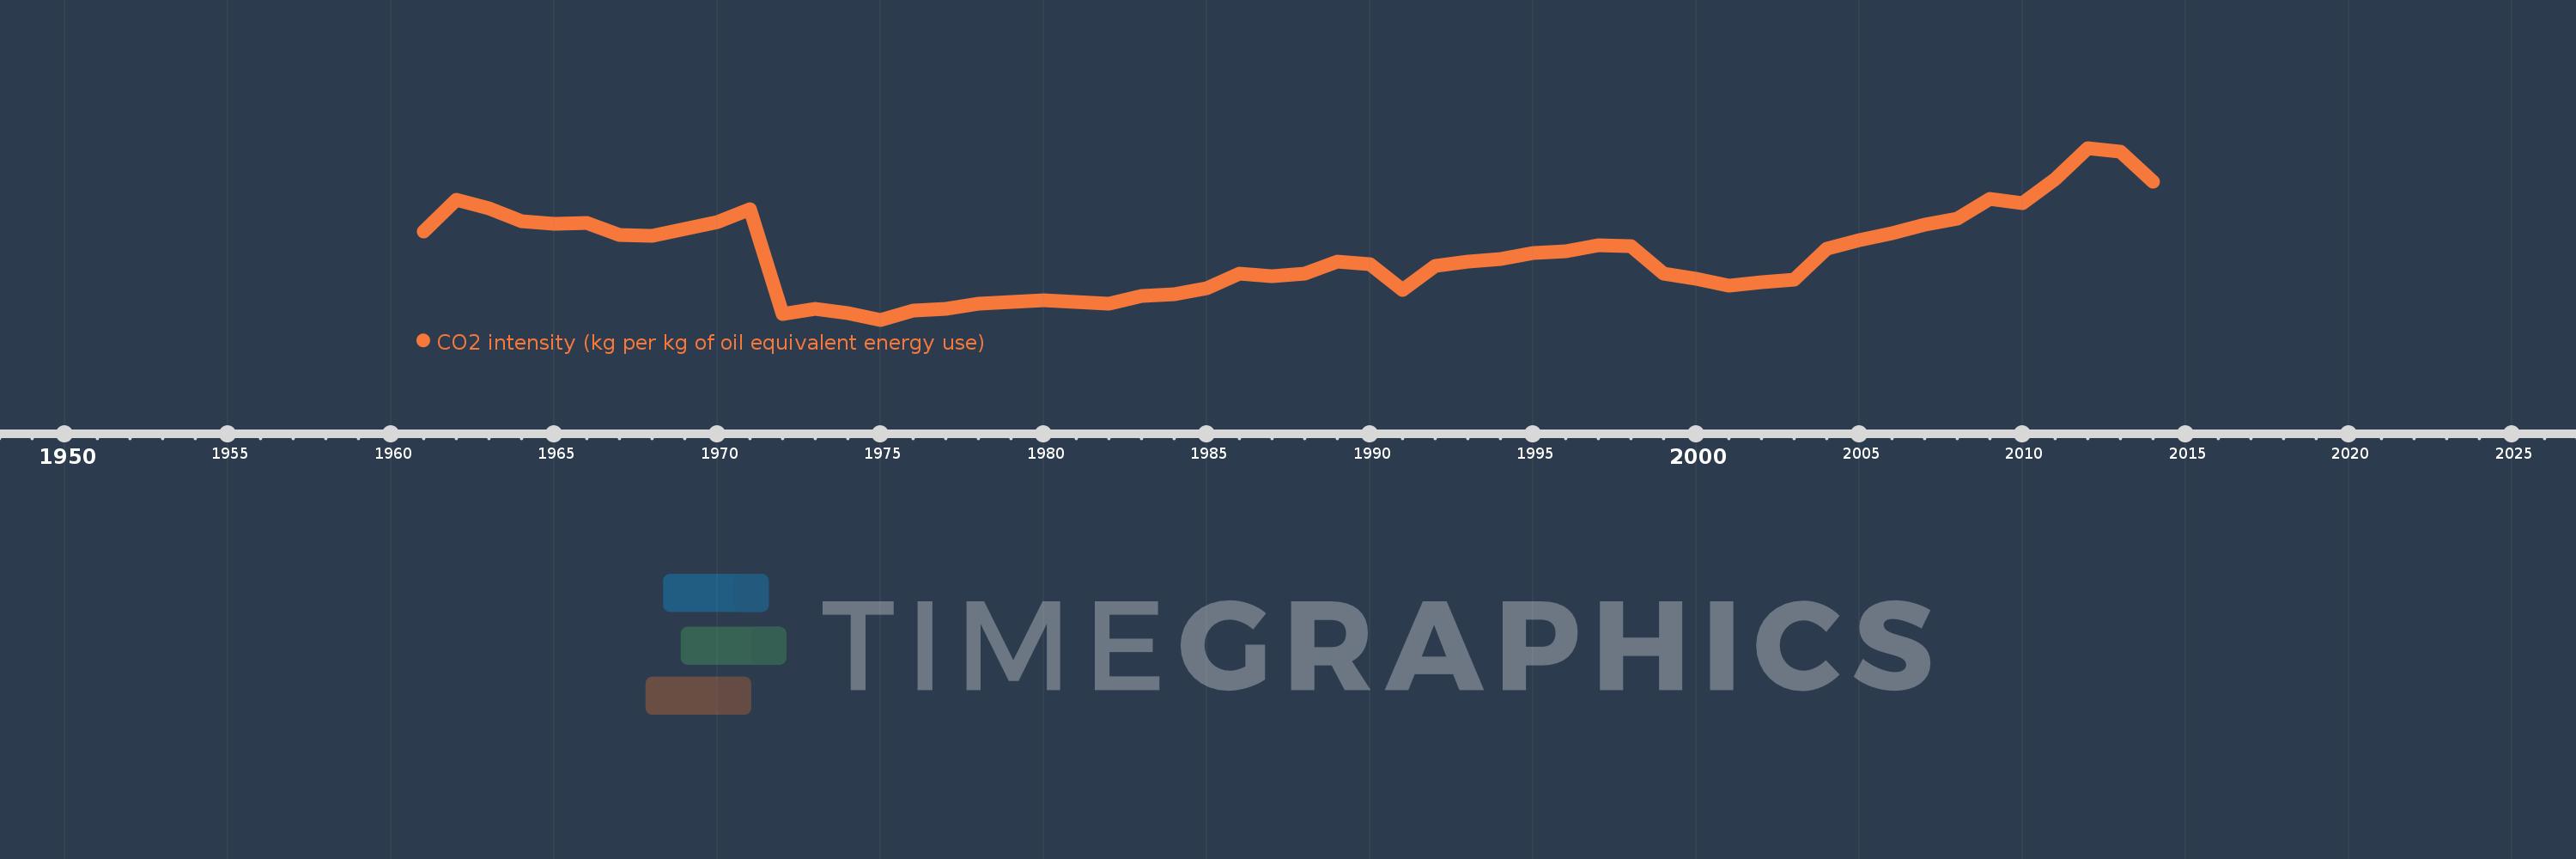
CO2 intensity (kg per kg of oil equivalent energy use)
2014,2013,2012,2011,2010,2009,2008,2007,2006,2005,2004,2003,2002,2001,2000,1999,1998,1997,1996,1995,1994,1993,1992,1991,1990,1989,1988,1987,1986,1985,1984,1983,1982,1981,1980,1979,1978,1977,1976,1975,1974,1973,1972,1971,1970,1969,1968,1967,1966,1965,1964,1963,1962,1961
This statistics in other country:
AlbaniaAlgeriaAngolaAntigua and BarbudaArab WorldArgentinaArmeniaAustraliaAustriaAzerbaijanBahamas, TheBahrainBangladeshBarbadosBelarusBelgiumBelizeBeninBhutanBoliviaBosnia and HerzegovinaBotswanaBrazilBrunei DarussalamBulgariaCabo VerdeCambodiaCameroonCanadaCaribbean small statesCentral Europe and the BalticsChileChinaColombiaComorosCongo, Dem. Rep.Congo, Rep.Costa RicaCote d'IvoireCroatiaCubaCuracaoCyprusCzech RepublicDenmarkDjiboutiDominicaDominican RepublicEarly-demographic dividendEast Asia & PacificEast Asia & Pacific (excluding high income)East Asia & Pacific (IDA & IBRD countries)EcuadorEgypt, Arab Rep.El SalvadorEquatorial GuineaEritreaEstoniaEthiopiaEuro areaEurope & Central AsiaEurope & Central Asia (excluding high income)Europe & Central Asia (IDA & IBRD countries)European UnionFijiFinlandFragile and conflict affected situationsFranceGabonGambia, TheGeorgiaGermanyGhanaGibraltarGreeceGrenadaGuatemalaGuinea-BissauGuyanaHaitiHeavily indebted poor countries (HIPC)High incomeHondurasHong Kong SAR, ChinaHungaryIBRD onlyIcelandIDA & IBRD totalIDA blendIDA onlyIDA totalIndiaIndonesiaIran, Islamic Rep.IraqIrelandIsraelItalyJamaicaJapanJordanKazakhstanKenyaKiribatiKorea, Dem. People’s Rep.Korea, Rep.KuwaitKyrgyz RepublicLate-demographic dividendLatin America & Caribbean Latin America & Caribbean (excluding high income)Latin America & the Caribbean (IDA & IBRD countries)LatviaLeast developed countries: UN classificationLebanonLesothoLibyaLithuaniaLow & middle incomeLow incomeLower middle incomeLuxembourgMacedonia, FYRMalaysiaMaldivesMaltaMarshall IslandsMauritiusMexicoMiddle East & North AfricaMiddle East & North Africa (excluding high income)Middle East & North Africa (IDA & IBRD countries)Middle incomeMoldovaMongoliaMontenegroMoroccoMozambiqueMyanmarNamibiaNepalNetherlandsNew ZealandNicaraguaNigerNigeriaNorth AmericaNorwayOECD membersOmanOther small statesPacific island small statesPakistanPalauPanamaParaguayPeruPhilippinesPolandPortugalPost-demographic dividendPre-demographic dividendQatarRomaniaRussian FederationSamoaSao Tome and PrincipeSaudi ArabiaSenegalSerbiaSeychellesSingaporeSlovak RepublicSloveniaSmall statesSolomon IslandsSouth AfricaSouth AsiaSouth Asia (IDA & IBRD)South SudanSpainSri LankaSt. Kitts and NevisSt. LuciaSt. Vincent and the GrenadinesSub-Saharan Africa Sub-Saharan Africa (excluding high income)Sub-Saharan Africa (IDA & IBRD countries)SudanSurinameSwazilandSwedenSwitzerlandSyrian Arab RepublicTajikistanTanzaniaThailandTimor-LesteTogoTongaTrinidad and TobagoTunisiaTurkeyTurkmenistanUkraineUnited Arab EmiratesUnited KingdomUnited StatesUpper middle incomeUruguayUzbekistanVanuatuVenezuela, RBVietnamWorldYemen, Rep.ZambiaZimbabwe Timeline:
This timeline shows a graph from 1961 to 2014 of East Asia & Pacific. No data until 1960. Number of actual observations by date: 54.
Source name:
World Development Indicators
Source organization:
Carbon Dioxide Information Analysis Center, Environmental Sciences Division, Oak Ridge National Laboratory, Tennessee, United States.
Categories, topics:
Climate Change, Environment
Last updated:
apr 23, 2017
Indicators value changes by year
At the date of observation
Value
Absolute change
Change from previous value
jan 1, 1961
2.859
+2.859
0.0%
jan 1, 1962
3.003
+0.145
5.06%
jan 1, 1963
2.964
-0.039
-1.3%
jan 1, 1964
2.907
-0.058
-1.94%
jan 1, 1965
2.894
-0.012
-0.43%
jan 1, 1966
2.898
+0.004
0.14%
jan 1, 1967
2.844
-0.054
-1.87%
jan 1, 1968
2.84
-0.004
-0.15%
jan 1, 1969
2.872
+0.032
1.13%
jan 1, 1970
2.901
+0.029
1.01%
jan 1, 1971
2.961
+0.061
2.1%
jan 1, 1972
2.494
-0.468
-15.8%
jan 1, 1973
2.514
+0.02
0.81%
jan 1, 1974
2.497
-0.017
-0.66%
jan 1, 1975
2.467
-0.03
-1.22%
jan 1, 1976
2.508
+0.041
1.68%
jan 1, 1977
2.516
+0.008
0.32%
jan 1, 1978
2.537
+0.021
0.84%
jan 1, 1979
2.548
+0.011
0.43%
jan 1, 1980
2.553
+0.005
0.21%
jan 1, 1981
2.545
-0.009
-0.34%
jan 1, 1982
2.538
-0.007
-0.26%
jan 1, 1983
2.573
+0.035
1.38%
jan 1, 1984
2.581
+0.008
0.3%
jan 1, 1985
2.606
+0.025
0.98%
jan 1, 1986
2.671
+0.065
2.49%
jan 1, 1987
2.662
-0.009
-0.33%
jan 1, 1988
2.673
+0.011
0.4%
jan 1, 1989
2.725
+0.053
1.97%
jan 1, 1990
2.713
-0.012
-0.44%
jan 1, 1991
2.601
-0.112
-4.12%
jan 1, 1992
2.705
+0.104
4.0%
jan 1, 1993
2.726
+0.021
0.78%
jan 1, 1994
2.736
+0.009
0.33%
jan 1, 1995
2.763
+0.027
1.0%
jan 1, 1996
2.77
+0.007
0.27%
jan 1, 1997
2.799
+0.029
1.05%
jan 1, 1998
2.796
-0.003
-0.11%
jan 1, 1999
2.671
-0.125
-4.47%
jan 1, 2000
2.648
-0.023
-0.87%
jan 1, 2001
2.617
-0.031
-1.17%
jan 1, 2002
2.635
+0.018
0.7%
jan 1, 2003
2.647
+0.011
0.43%
jan 1, 2004
2.783
+0.136
5.13%
jan 1, 2005
2.823
+0.041
1.46%
jan 1, 2006
2.852
+0.028
1.01%
jan 1, 2007
2.889
+0.037
1.3%
jan 1, 2008
2.919
+0.03
1.04%
jan 1, 2009
3.005
+0.086
2.96%
jan 1, 2010
2.987
-0.018
-0.61%
jan 1, 2011
3.093
+0.106
3.55%
jan 1, 2012
3.232
+0.139
4.48%
jan 1, 2013
3.215
-0.016
-0.51%
jan 1, 2014
3.08
-0.135
-4.2%
Ranking of countries by current statistics by years


Comments: