29
/
en
AIzaSyAYiBZKx7MnpbEhh9jyipgxe19OcubqV5w
April 1, 2024
277466
Uruguay
URY
true
2
1
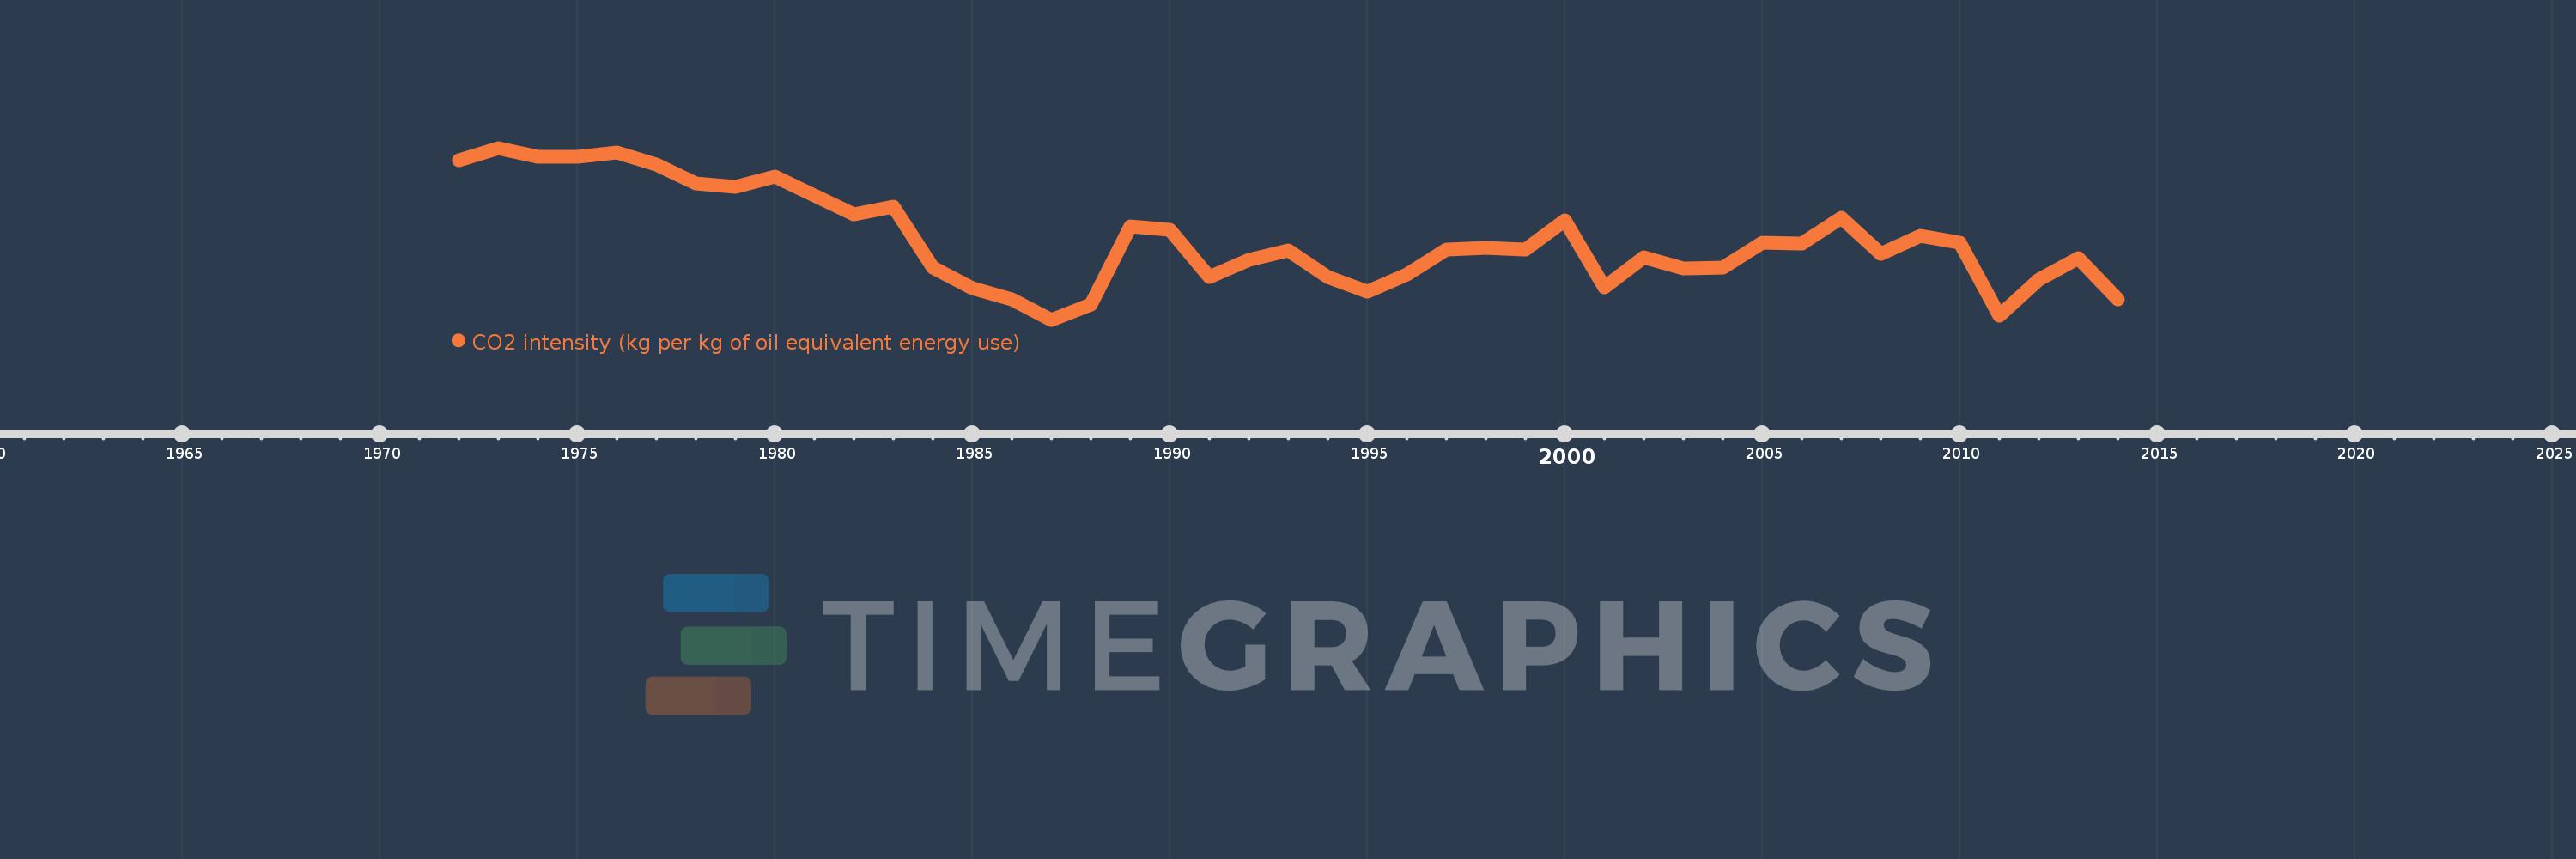
CO2 intensity (kg per kg of oil equivalent energy use)
2014,2013,2012,2011,2010,2009,2008,2007,2006,2005,2004,2003,2002,2001,2000,1999,1998,1997,1996,1995,1994,1993,1992,1991,1990,1989,1988,1987,1986,1985,1984,1983,1982,1981,1980,1979,1978,1977,1976,1975,1974,1973,1972
This statistics in other country:
AlbaniaAlgeriaAngolaAntigua and BarbudaArab WorldArgentinaArmeniaAustraliaAustriaAzerbaijanBahamas, TheBahrainBangladeshBarbadosBelarusBelgiumBelizeBeninBhutanBoliviaBosnia and HerzegovinaBotswanaBrazilBrunei DarussalamBulgariaCabo VerdeCambodiaCameroonCanadaCaribbean small statesCentral Europe and the BalticsChileChinaColombiaComorosCongo, Dem. Rep.Congo, Rep.Costa RicaCote d'IvoireCroatiaCubaCuracaoCyprusCzech RepublicDenmarkDjiboutiDominicaDominican RepublicEarly-demographic dividendEast Asia & PacificEast Asia & Pacific (excluding high income)East Asia & Pacific (IDA & IBRD countries)EcuadorEgypt, Arab Rep.El SalvadorEquatorial GuineaEritreaEstoniaEthiopiaEuro areaEurope & Central AsiaEurope & Central Asia (excluding high income)Europe & Central Asia (IDA & IBRD countries)European UnionFijiFinlandFragile and conflict affected situationsFranceGabonGambia, TheGeorgiaGermanyGhanaGibraltarGreeceGrenadaGuatemalaGuinea-BissauGuyanaHaitiHeavily indebted poor countries (HIPC)High incomeHondurasHong Kong SAR, ChinaHungaryIBRD onlyIcelandIDA & IBRD totalIDA blendIDA onlyIDA totalIndiaIndonesiaIran, Islamic Rep.IraqIrelandIsraelItalyJamaicaJapanJordanKazakhstanKenyaKiribatiKorea, Dem. People’s Rep.Korea, Rep.KuwaitKyrgyz RepublicLate-demographic dividendLatin America & Caribbean Latin America & Caribbean (excluding high income)Latin America & the Caribbean (IDA & IBRD countries)LatviaLeast developed countries: UN classificationLebanonLesothoLibyaLithuaniaLow & middle incomeLow incomeLower middle incomeLuxembourgMacedonia, FYRMalaysiaMaldivesMaltaMarshall IslandsMauritiusMexicoMiddle East & North AfricaMiddle East & North Africa (excluding high income)Middle East & North Africa (IDA & IBRD countries)Middle incomeMoldovaMongoliaMontenegroMoroccoMozambiqueMyanmarNamibiaNepalNetherlandsNew ZealandNicaraguaNigerNigeriaNorth AmericaNorwayOECD membersOmanOther small statesPacific island small statesPakistanPalauPanamaParaguayPeruPhilippinesPolandPortugalPost-demographic dividendPre-demographic dividendQatarRomaniaRussian FederationSamoaSao Tome and PrincipeSaudi ArabiaSenegalSerbiaSeychellesSingaporeSlovak RepublicSloveniaSmall statesSolomon IslandsSouth AfricaSouth AsiaSouth Asia (IDA & IBRD)South SudanSpainSri LankaSt. Kitts and NevisSt. LuciaSt. Vincent and the GrenadinesSub-Saharan Africa Sub-Saharan Africa (excluding high income)Sub-Saharan Africa (IDA & IBRD countries)SudanSurinameSwazilandSwedenSwitzerlandSyrian Arab RepublicTajikistanTanzaniaThailandTimor-LesteTogoTongaTrinidad and TobagoTunisiaTurkeyTurkmenistanUkraineUnited Arab EmiratesUnited KingdomUnited StatesUpper middle incomeUruguayUzbekistanVanuatuVenezuela, RBVietnamWorldYemen, Rep.ZambiaZimbabwe Timeline:
This timeline shows a graph from 1972 to 2014 of Uruguay. No data until 1971. Number of actual observations by date: 43.
Source name:
World Development Indicators
Source organization:
Carbon Dioxide Information Analysis Center, Environmental Sciences Division, Oak Ridge National Laboratory, Tennessee, United States.
Categories, topics:
Climate Change, Environment
Last updated:
apr 23, 2017
Indicators value changes by year
At the date of observation
Value
Absolute change
Change from previous value
jan 1, 1972
2.403
+2.403
0.0%
jan 1, 1973
2.467
+0.064
2.64%
jan 1, 1974
2.42
-0.047
-1.91%
jan 1, 1975
2.418
-0.002
-0.08%
jan 1, 1976
2.442
+0.023
0.97%
jan 1, 1977
2.376
-0.065
-2.66%
jan 1, 1978
2.277
-0.1
-4.21%
jan 1, 1979
2.259
-0.017
-0.77%
jan 1, 1980
2.312
+0.053
2.36%
jan 1, 1981
2.209
-0.104
-4.49%
jan 1, 1982
2.11
-0.098
-4.45%
jan 1, 1983
2.153
+0.043
2.04%
jan 1, 1984
1.821
-0.332
-15.4%
jan 1, 1985
1.714
-0.108
-5.91%
jan 1, 1986
1.65
-0.064
-3.71%
jan 1, 1987
1.542
-0.108
-6.53%
jan 1, 1988
1.625
+0.083
5.36%
jan 1, 1989
2.047
+0.422
25.95%
jan 1, 1990
2.025
-0.022
-1.06%
jan 1, 1991
1.774
-0.251
-12.39%
jan 1, 1992
1.866
+0.092
5.17%
jan 1, 1993
1.917
+0.051
2.73%
jan 1, 1994
1.774
-0.142
-7.43%
jan 1, 1995
1.691
-0.083
-4.68%
jan 1, 1996
1.785
+0.094
5.56%
jan 1, 1997
1.919
+0.134
7.53%
jan 1, 1998
1.929
+0.009
0.48%
jan 1, 1999
1.918
-0.01
-0.53%
jan 1, 2000
2.078
+0.16
8.33%
jan 1, 2001
1.716
-0.362
-17.42%
jan 1, 2002
1.877
+0.161
9.38%
jan 1, 2003
1.82
-0.057
-3.02%
jan 1, 2004
1.823
+0.002
0.12%
jan 1, 2005
1.956
+0.133
7.29%
jan 1, 2006
1.953
-0.002
-0.13%
jan 1, 2007
2.089
+0.136
6.95%
jan 1, 2008
1.896
-0.193
-9.22%
jan 1, 2009
1.995
+0.099
5.21%
jan 1, 2010
1.956
-0.039
-1.98%
jan 1, 2011
1.562
-0.394
-20.13%
jan 1, 2012
1.757
+0.195
12.51%
jan 1, 2013
1.875
+0.117
6.68%
jan 1, 2014
1.652
-0.222
-11.86%
Ranking of countries by current statistics by years


Comments: