29
/
en
AIzaSyAYiBZKx7MnpbEhh9jyipgxe19OcubqV5w
April 1, 2024
161287
Italy
ITA
true
2
1
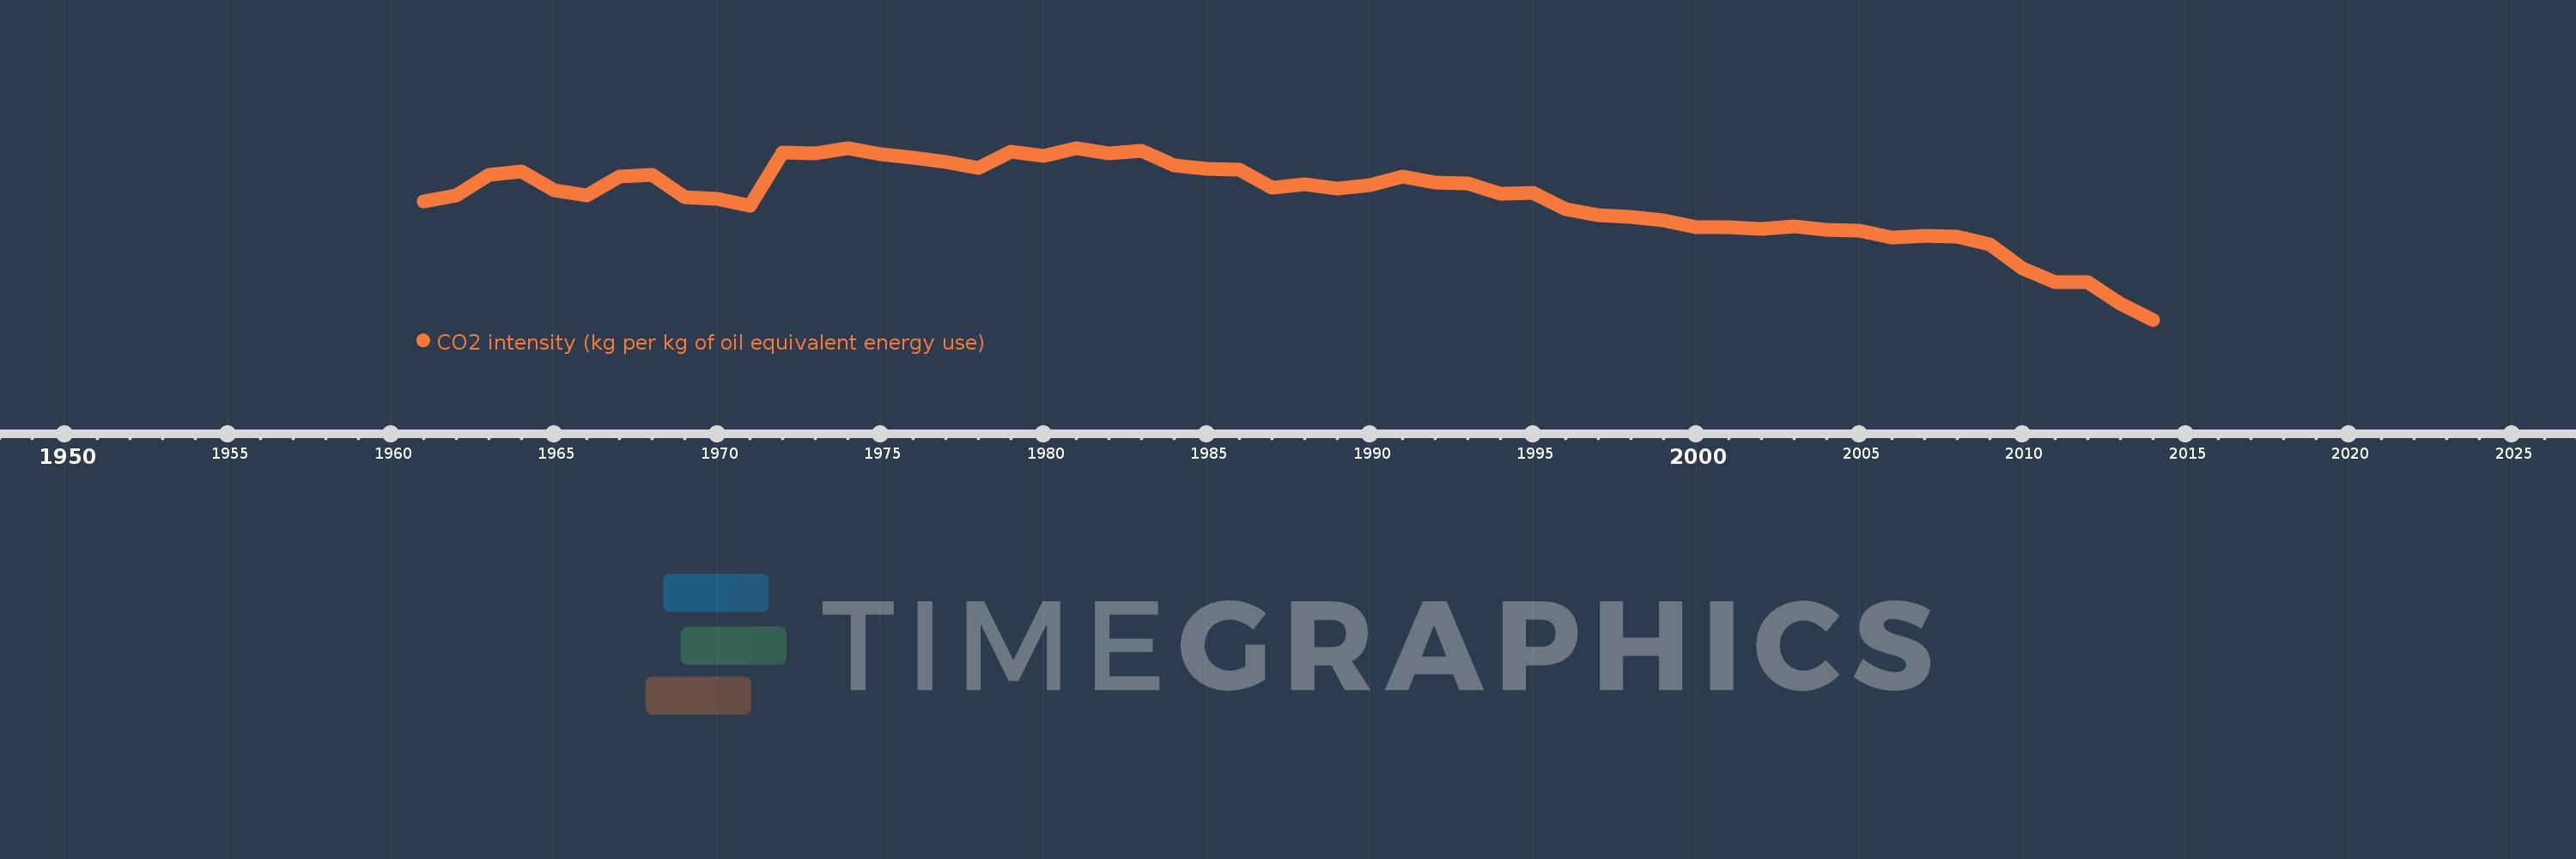
CO2 intensity (kg per kg of oil equivalent energy use)
2014,2013,2012,2011,2010,2009,2008,2007,2006,2005,2004,2003,2002,2001,2000,1999,1998,1997,1996,1995,1994,1993,1992,1991,1990,1989,1988,1987,1986,1985,1984,1983,1982,1981,1980,1979,1978,1977,1976,1975,1974,1973,1972,1971,1970,1969,1968,1967,1966,1965,1964,1963,1962,1961
This statistics in other country:
AlbaniaAlgeriaAngolaAntigua and BarbudaArab WorldArgentinaArmeniaAustraliaAustriaAzerbaijanBahamas, TheBahrainBangladeshBarbadosBelarusBelgiumBelizeBeninBhutanBoliviaBosnia and HerzegovinaBotswanaBrazilBrunei DarussalamBulgariaCabo VerdeCambodiaCameroonCanadaCaribbean small statesCentral Europe and the BalticsChileChinaColombiaComorosCongo, Dem. Rep.Congo, Rep.Costa RicaCote d'IvoireCroatiaCubaCuracaoCyprusCzech RepublicDenmarkDjiboutiDominicaDominican RepublicEarly-demographic dividendEast Asia & PacificEast Asia & Pacific (excluding high income)East Asia & Pacific (IDA & IBRD countries)EcuadorEgypt, Arab Rep.El SalvadorEquatorial GuineaEritreaEstoniaEthiopiaEuro areaEurope & Central AsiaEurope & Central Asia (excluding high income)Europe & Central Asia (IDA & IBRD countries)European UnionFijiFinlandFragile and conflict affected situationsFranceGabonGambia, TheGeorgiaGermanyGhanaGibraltarGreeceGrenadaGuatemalaGuinea-BissauGuyanaHaitiHeavily indebted poor countries (HIPC)High incomeHondurasHong Kong SAR, ChinaHungaryIBRD onlyIcelandIDA & IBRD totalIDA blendIDA onlyIDA totalIndiaIndonesiaIran, Islamic Rep.IraqIrelandIsraelItalyJamaicaJapanJordanKazakhstanKenyaKiribatiKorea, Dem. People’s Rep.Korea, Rep.KuwaitKyrgyz RepublicLate-demographic dividendLatin America & Caribbean Latin America & Caribbean (excluding high income)Latin America & the Caribbean (IDA & IBRD countries)LatviaLeast developed countries: UN classificationLebanonLesothoLibyaLithuaniaLow & middle incomeLow incomeLower middle incomeLuxembourgMacedonia, FYRMalaysiaMaldivesMaltaMarshall IslandsMauritiusMexicoMiddle East & North AfricaMiddle East & North Africa (excluding high income)Middle East & North Africa (IDA & IBRD countries)Middle incomeMoldovaMongoliaMontenegroMoroccoMozambiqueMyanmarNamibiaNepalNetherlandsNew ZealandNicaraguaNigerNigeriaNorth AmericaNorwayOECD membersOmanOther small statesPacific island small statesPakistanPalauPanamaParaguayPeruPhilippinesPolandPortugalPost-demographic dividendPre-demographic dividendQatarRomaniaRussian FederationSamoaSao Tome and PrincipeSaudi ArabiaSenegalSerbiaSeychellesSingaporeSlovak RepublicSloveniaSmall statesSolomon IslandsSouth AfricaSouth AsiaSouth Asia (IDA & IBRD)South SudanSpainSri LankaSt. Kitts and NevisSt. LuciaSt. Vincent and the GrenadinesSub-Saharan Africa Sub-Saharan Africa (excluding high income)Sub-Saharan Africa (IDA & IBRD countries)SudanSurinameSwazilandSwedenSwitzerlandSyrian Arab RepublicTajikistanTanzaniaThailandTimor-LesteTogoTongaTrinidad and TobagoTunisiaTurkeyTurkmenistanUkraineUnited Arab EmiratesUnited KingdomUnited StatesUpper middle incomeUruguayUzbekistanVanuatuVenezuela, RBVietnamWorldYemen, Rep.ZambiaZimbabwe Timeline:
This timeline shows a graph from 1961 to 2014 of Italy. No data until 1960. Number of actual observations by date: 54.
Source name:
World Development Indicators
Source organization:
Carbon Dioxide Information Analysis Center, Environmental Sciences Division, Oak Ridge National Laboratory, Tennessee, United States.
Categories, topics:
Climate Change, Environment
Last updated:
apr 23, 2017
Indicators value changes by year
At the date of observation
Value
Absolute change
Change from previous value
jan 1, 1961
2.741
+2.741
0.0%
jan 1, 1962
2.767
+0.026
0.96%
jan 1, 1963
2.858
+0.091
3.3%
jan 1, 1964
2.871
+0.013
0.45%
jan 1, 1965
2.787
-0.084
-2.93%
jan 1, 1966
2.766
-0.021
-0.75%
jan 1, 1967
2.851
+0.084
3.05%
jan 1, 1968
2.856
+0.006
0.2%
jan 1, 1969
2.759
-0.097
-3.39%
jan 1, 1970
2.752
-0.007
-0.26%
jan 1, 1971
2.721
-0.031
-1.13%
jan 1, 1972
2.956
+0.235
8.65%
jan 1, 1973
2.95
-0.006
-0.22%
jan 1, 1974
2.975
+0.025
0.84%
jan 1, 1975
2.948
-0.027
-0.89%
jan 1, 1976
2.932
-0.016
-0.55%
jan 1, 1977
2.912
-0.02
-0.68%
jan 1, 1978
2.888
-0.024
-0.82%
jan 1, 1979
2.957
+0.069
2.4%
jan 1, 1980
2.94
-0.017
-0.58%
jan 1, 1981
2.973
+0.033
1.12%
jan 1, 1982
2.953
-0.02
-0.68%
jan 1, 1983
2.963
+0.01
0.35%
jan 1, 1984
2.899
-0.064
-2.17%
jan 1, 1985
2.883
-0.015
-0.53%
jan 1, 1986
2.878
-0.005
-0.19%
jan 1, 1987
2.801
-0.077
-2.67%
jan 1, 1988
2.816
+0.015
0.53%
jan 1, 1989
2.795
-0.021
-0.75%
jan 1, 1990
2.812
+0.017
0.61%
jan 1, 1991
2.849
+0.037
1.33%
jan 1, 1992
2.823
-0.026
-0.92%
jan 1, 1993
2.818
-0.005
-0.17%
jan 1, 1994
2.775
-0.043
-1.53%
jan 1, 1995
2.779
+0.005
0.16%
jan 1, 1996
2.705
-0.074
-2.67%
jan 1, 1997
2.678
-0.027
-0.99%
jan 1, 1998
2.67
-0.009
-0.32%
jan 1, 1999
2.655
-0.014
-0.54%
jan 1, 2000
2.626
-0.029
-1.1%
jan 1, 2001
2.627
+0.001
0.04%
jan 1, 2002
2.62
-0.007
-0.26%
jan 1, 2003
2.628
+0.008
0.32%
jan 1, 2004
2.614
-0.014
-0.53%
jan 1, 2005
2.61
-0.005
-0.18%
jan 1, 2006
2.579
-0.031
-1.18%
jan 1, 2007
2.59
+0.011
0.43%
jan 1, 2008
2.585
-0.005
-0.18%
jan 1, 2009
2.55
-0.035
-1.36%
jan 1, 2010
2.443
-0.107
-4.2%
jan 1, 2011
2.385
-0.059
-2.4%
jan 1, 2012
2.385
+0.0
0.01%
jan 1, 2013
2.29
-0.094
-3.96%
jan 1, 2014
2.219
-0.071
-3.11%
Ranking of countries by current statistics by years


Comments: