29
/
en
AIzaSyAYiBZKx7MnpbEhh9jyipgxe19OcubqV5w
April 1, 2024
39774
IDA total
IDA
false
2
1
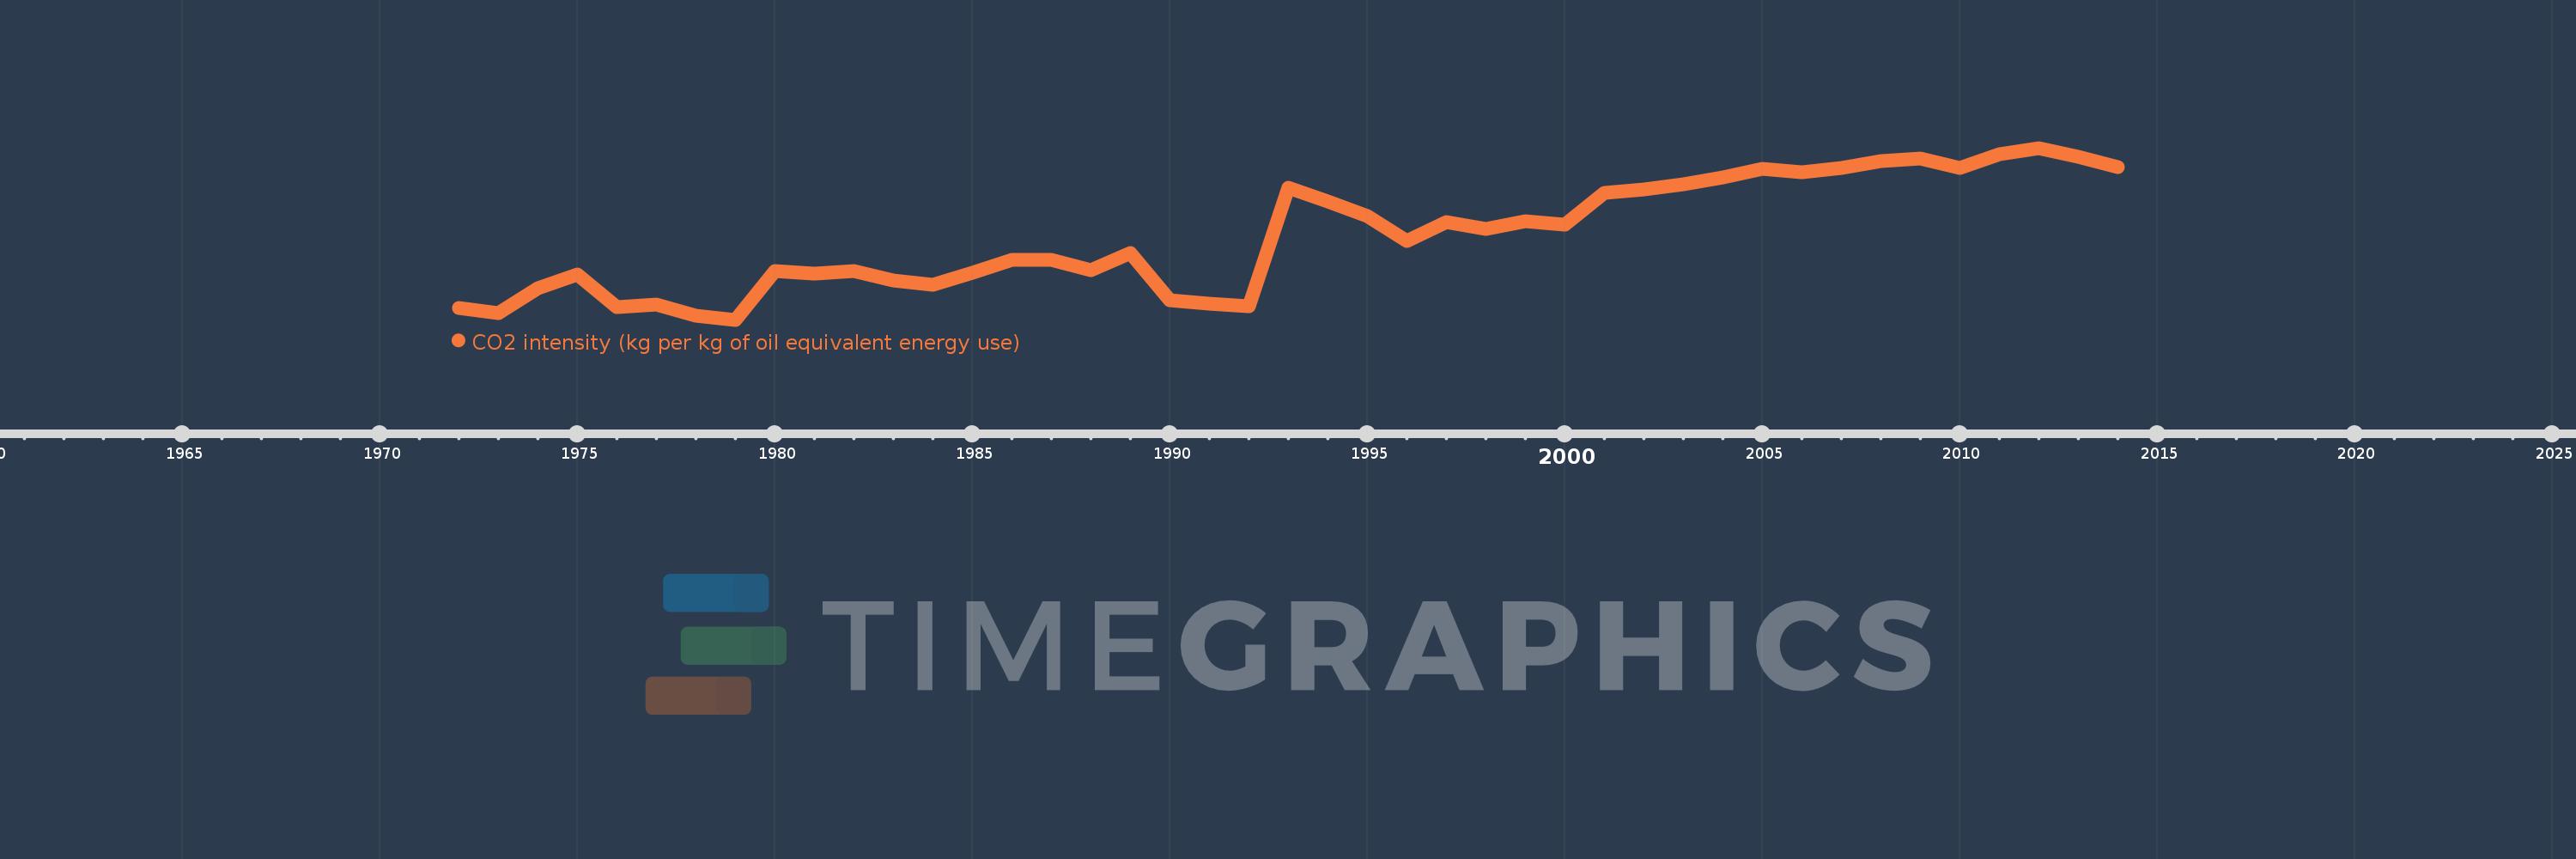
CO2 intensity (kg per kg of oil equivalent energy use)
2014,2013,2012,2011,2010,2009,2008,2007,2006,2005,2004,2003,2002,2001,2000,1999,1998,1997,1996,1995,1994,1993,1992,1991,1990,1989,1988,1987,1986,1985,1984,1983,1982,1981,1980,1979,1978,1977,1976,1975,1974,1973,1972
This statistics in other country:
AlbaniaAlgeriaAngolaAntigua and BarbudaArab WorldArgentinaArmeniaAustraliaAustriaAzerbaijanBahamas, TheBahrainBangladeshBarbadosBelarusBelgiumBelizeBeninBhutanBoliviaBosnia and HerzegovinaBotswanaBrazilBrunei DarussalamBulgariaCabo VerdeCambodiaCameroonCanadaCaribbean small statesCentral Europe and the BalticsChileChinaColombiaComorosCongo, Dem. Rep.Congo, Rep.Costa RicaCote d'IvoireCroatiaCubaCuracaoCyprusCzech RepublicDenmarkDjiboutiDominicaDominican RepublicEarly-demographic dividendEast Asia & PacificEast Asia & Pacific (excluding high income)East Asia & Pacific (IDA & IBRD countries)EcuadorEgypt, Arab Rep.El SalvadorEquatorial GuineaEritreaEstoniaEthiopiaEuro areaEurope & Central AsiaEurope & Central Asia (excluding high income)Europe & Central Asia (IDA & IBRD countries)European UnionFijiFinlandFragile and conflict affected situationsFranceGabonGambia, TheGeorgiaGermanyGhanaGibraltarGreeceGrenadaGuatemalaGuinea-BissauGuyanaHaitiHeavily indebted poor countries (HIPC)High incomeHondurasHong Kong SAR, ChinaHungaryIBRD onlyIcelandIDA & IBRD totalIDA blendIDA onlyIDA totalIndiaIndonesiaIran, Islamic Rep.IraqIrelandIsraelItalyJamaicaJapanJordanKazakhstanKenyaKiribatiKorea, Dem. People’s Rep.Korea, Rep.KuwaitKyrgyz RepublicLate-demographic dividendLatin America & Caribbean Latin America & Caribbean (excluding high income)Latin America & the Caribbean (IDA & IBRD countries)LatviaLeast developed countries: UN classificationLebanonLesothoLibyaLithuaniaLow & middle incomeLow incomeLower middle incomeLuxembourgMacedonia, FYRMalaysiaMaldivesMaltaMarshall IslandsMauritiusMexicoMiddle East & North AfricaMiddle East & North Africa (excluding high income)Middle East & North Africa (IDA & IBRD countries)Middle incomeMoldovaMongoliaMontenegroMoroccoMozambiqueMyanmarNamibiaNepalNetherlandsNew ZealandNicaraguaNigerNigeriaNorth AmericaNorwayOECD membersOmanOther small statesPacific island small statesPakistanPalauPanamaParaguayPeruPhilippinesPolandPortugalPost-demographic dividendPre-demographic dividendQatarRomaniaRussian FederationSamoaSao Tome and PrincipeSaudi ArabiaSenegalSerbiaSeychellesSingaporeSlovak RepublicSloveniaSmall statesSolomon IslandsSouth AfricaSouth AsiaSouth Asia (IDA & IBRD)South SudanSpainSri LankaSt. Kitts and NevisSt. LuciaSt. Vincent and the GrenadinesSub-Saharan Africa Sub-Saharan Africa (excluding high income)Sub-Saharan Africa (IDA & IBRD countries)SudanSurinameSwazilandSwedenSwitzerlandSyrian Arab RepublicTajikistanTanzaniaThailandTimor-LesteTogoTongaTrinidad and TobagoTunisiaTurkeyTurkmenistanUkraineUnited Arab EmiratesUnited KingdomUnited StatesUpper middle incomeUruguayUzbekistanVanuatuVenezuela, RBVietnamWorldYemen, Rep.ZambiaZimbabwe Timeline:
This timeline shows a graph from 1972 to 2014 of IDA total. No data until 1971. Number of actual observations by date: 43.
Source name:
World Development Indicators
Source organization:
Carbon Dioxide Information Analysis Center, Environmental Sciences Division, Oak Ridge National Laboratory, Tennessee, United States.
Categories, topics:
Climate Change, Environment
Last updated:
apr 23, 2017
Indicators value changes by year
At the date of observation
Value
Absolute change
Change from previous value
jan 1, 1972
0.941
+0.941
0.0%
jan 1, 1973
0.927
-0.014
-1.5%
jan 1, 1974
0.996
+0.069
7.42%
jan 1, 1975
1.035
+0.039
3.92%
jan 1, 1976
0.944
-0.091
-8.79%
jan 1, 1977
0.95
+0.006
0.61%
jan 1, 1978
0.919
-0.031
-3.29%
jan 1, 1979
0.908
-0.01
-1.12%
jan 1, 1980
1.044
+0.135
14.88%
jan 1, 1981
1.038
-0.006
-0.55%
jan 1, 1982
1.044
+0.006
0.57%
jan 1, 1983
1.019
-0.025
-2.38%
jan 1, 1984
1.005
-0.013
-1.32%
jan 1, 1985
1.041
+0.036
3.59%
jan 1, 1986
1.075
+0.033
3.18%
jan 1, 1987
1.075
0.0
0.0%
jan 1, 1988
1.046
-0.029
-2.66%
jan 1, 1989
1.095
+0.048
4.64%
jan 1, 1990
0.963
-0.131
-12.0%
jan 1, 1991
0.953
-0.01
-1.04%
jan 1, 1992
0.945
-0.009
-0.9%
jan 1, 1993
1.278
+0.334
35.33%
jan 1, 1994
1.239
-0.039
-3.04%
jan 1, 1995
1.199
-0.04
-3.24%
jan 1, 1996
1.129
-0.07
-5.82%
jan 1, 1997
1.182
+0.052
4.61%
jan 1, 1998
1.162
-0.019
-1.63%
jan 1, 1999
1.184
+0.022
1.86%
jan 1, 2000
1.175
-0.008
-0.71%
jan 1, 2001
1.264
+0.088
7.52%
jan 1, 2002
1.273
+0.009
0.75%
jan 1, 2003
1.289
+0.015
1.21%
jan 1, 2004
1.308
+0.019
1.5%
jan 1, 2005
1.332
+0.024
1.87%
jan 1, 2006
1.323
-0.009
-0.69%
jan 1, 2007
1.334
+0.01
0.78%
jan 1, 2008
1.354
+0.02
1.53%
jan 1, 2009
1.36
+0.006
0.44%
jan 1, 2010
1.334
-0.026
-1.94%
jan 1, 2011
1.372
+0.038
2.88%
jan 1, 2012
1.39
+0.018
1.31%
jan 1, 2013
1.365
-0.025
-1.83%
jan 1, 2014
1.337
-0.027
-2.01%
Ranking of countries by current statistics by years


Comments: